Section 1: Company Overview and Fundamentals
1.1 Company Overview:
Tencent Music Entertainment Group (NYSE: TME) is a holding company that operates an integrated online music entertainment platform in China. It provides online music streaming and social entertainment services through its key brands QQ Music, Kugou Music, Kuwo Music, and WeSing. The company also expands its content offering with Lazy Audio, a long-form audio platform complementing its core music ecosystem.
Kalkine’s American Tech Report covers the Company Overview, Key positives & negatives, Investment summary, Key investment metrics, Top 10 shareholding, Business updates and insights into company recent financial results, Key Risks & Outlook, Price performance and technical summary, Target Price, and Recommendation on the stock.
Price Performance:
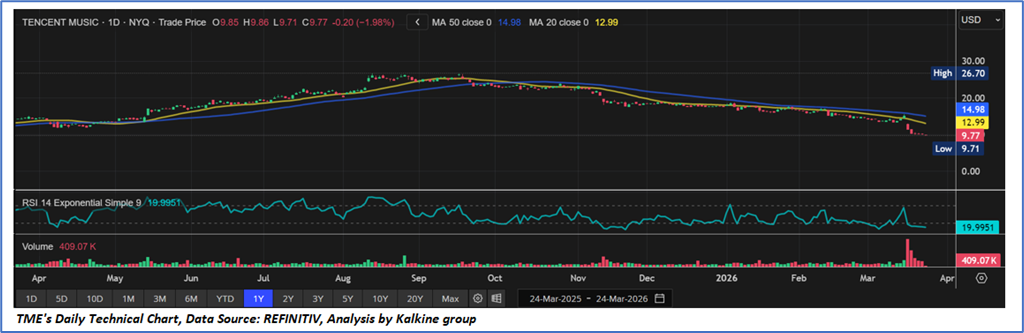
- Trend Structure: The stock has shifted from an earlier uptrend into a sustained downtrend, forming lower highs and lower lows since its peak around August–September.
- Moving Averages: The price is trading below both the 20-day and 50-day moving averages, indicating continued bearish momentum and no clear signs of a near-term reversal.
- Resistance Levels: Immediate resistance is around USD 12.9, followed by stronger resistance near USD 14.9, where previous breakdowns occurred.
- Support Levels: The stock is trading close to its recent low near USD 9.7, which serves as a key support level; a break below this may lead to further downside.
- RSI Momentum: The RSI is near 20, indicating oversold conditions, which may support a short-term bounce but does not confirm a reversal.
- Volume Trends: Increased volume during price declines suggests ongoing selling pressure.
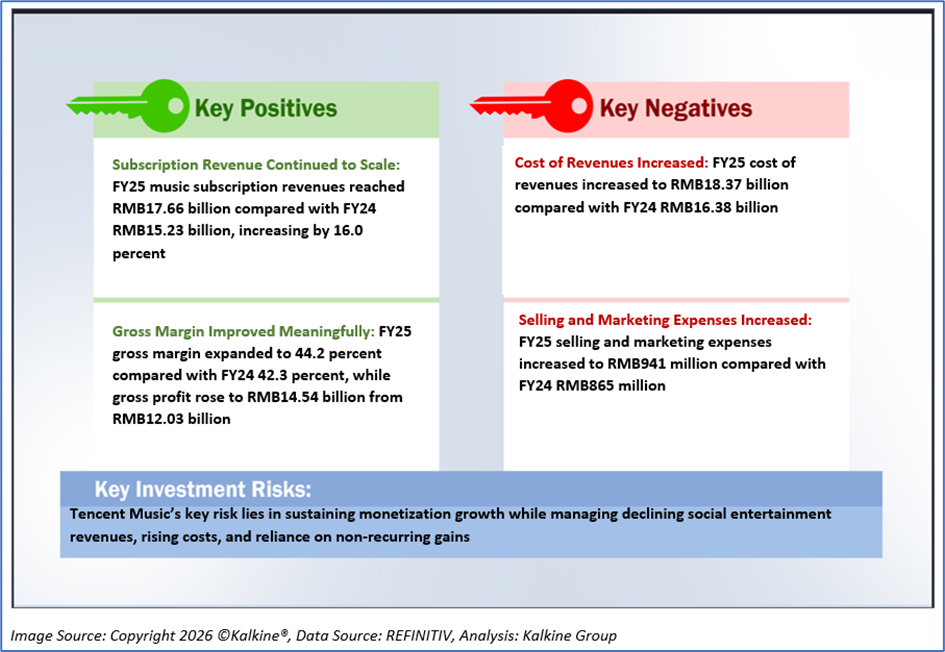
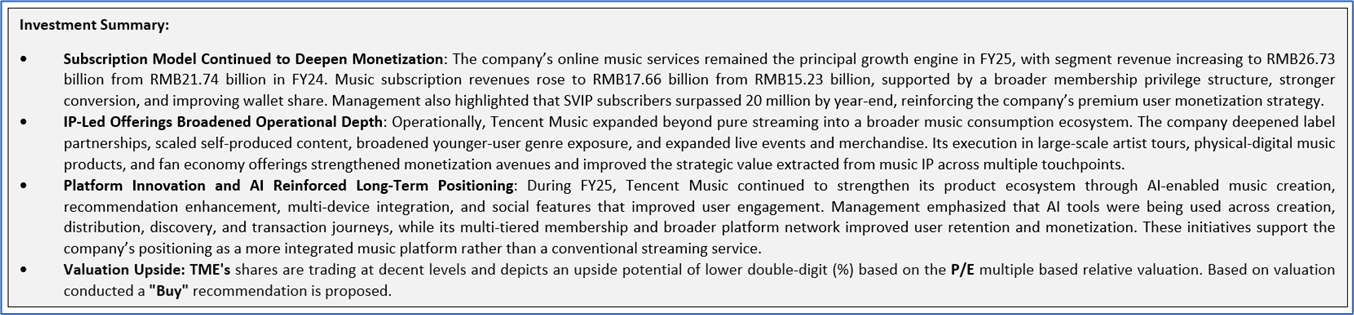
1.2 The Key Positives, Negatives, and Investment summary
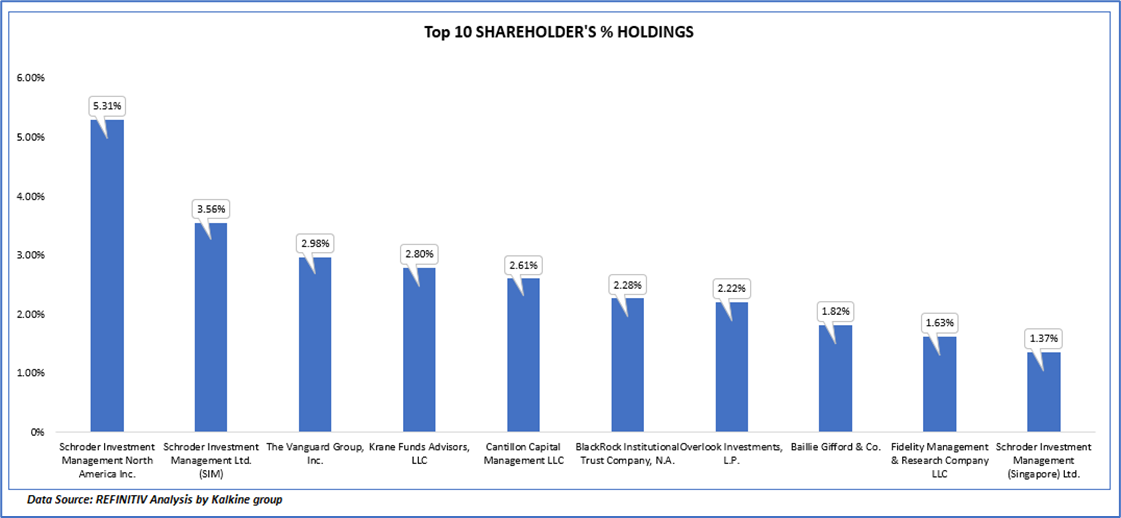
1.3 Top 10 shareholders:
The top 10 shareholders together form ~26.56% of the total shareholding, signifying dispersed shareholding. Schroder Investment Management North America Inc. and Schroder Investment Management Ltd. (SIM) are the biggest shareholders, holding the maximum stake in the company at ~5.31% and ~3.56%, respectively.
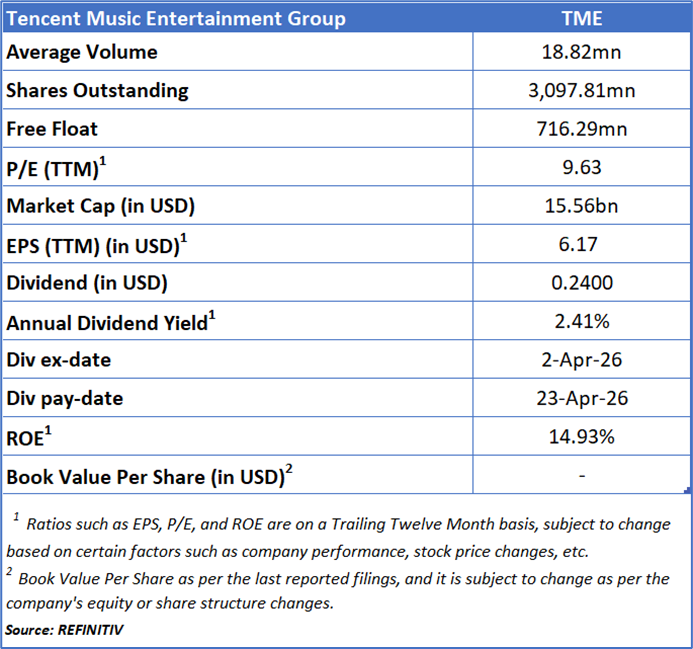
1.4 Key Metrics:
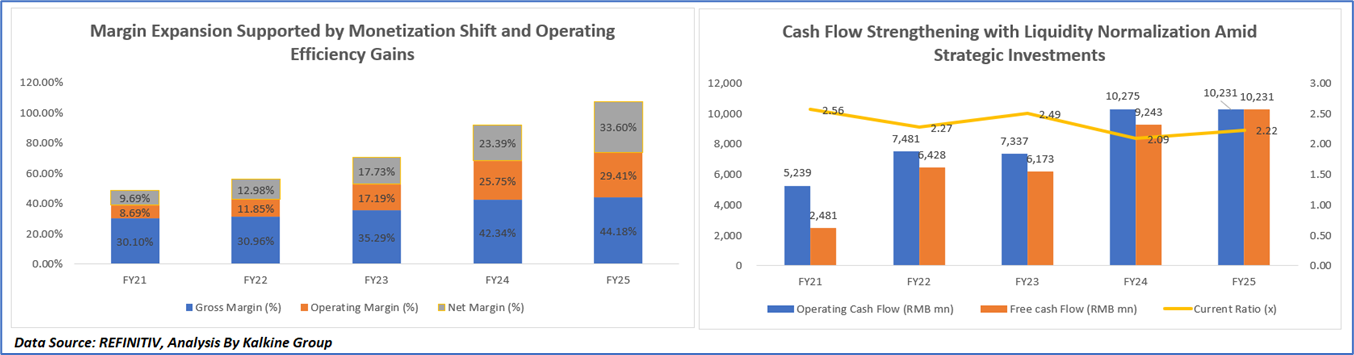
Margin Expansion Supported by Monetization Shift and Operating Efficiency Gains
The steady expansion in gross, operating, and net margins from FY21 to FY25 reflects Tencent Music’s structural transition toward a higher-quality, more profitable revenue mix driven by the rapid growth of online music services, particularly subscriptions and advertising, which carry superior margins compared to the declining social entertainment segment. This improvement was further supported by rising paying users and ARPPU, the rollout of multi-tier membership offerings such as SVIP, and enhanced monetization of music IP through content partnerships, self-produced music, live events, and merchandise. Additionally, disciplined cost optimization, improved operating efficiency, and the scaling of high-margin ancillary revenue streams contributed to profitability gains, while technology and AI-driven enhancements in user engagement and content distribution further strengthened monetization efficiency, collectively driving sustained margin expansion over the period.
Cash Flow Strengthening with Liquidity Normalization Amid Strategic Investments
The trend in operating cash flow and free cash flow from FY21 to FY25 reflects a steady improvement in Tencent Music’s core cash generation, driven by the expansion of its higher-margin online music business, including strong subscription growth, rising ARPPU, and increased monetization through advertising, live events, and merchandise. Improved operating efficiency and a favorable revenue mix supported higher cash flows over time, while the narrowing gap between operating and free cash flow in FY25 indicates better cash conversion and relatively lower reinvestment intensity. Meanwhile, the decline in the current ratio through FY24 suggests greater capital deployment toward content, technology, and ecosystem investments, along with shareholder returns, with the modest recovery in FY25 indicating a stabilization in liquidity as cash generation strengthened, reflecting a more balanced and self-sustaining financial profile.
Section 2: Business Updates and Financial Highlights
2.1 Recent Updates:
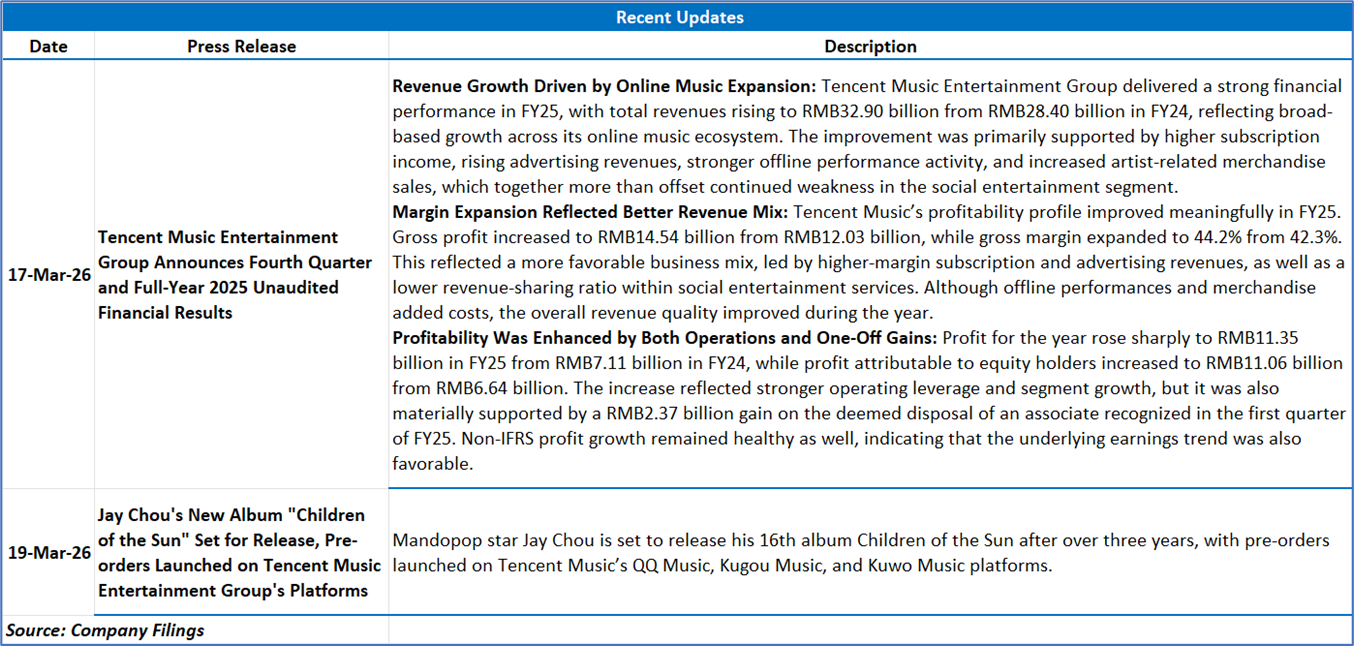
The below picture gives an overview of the recent updates:
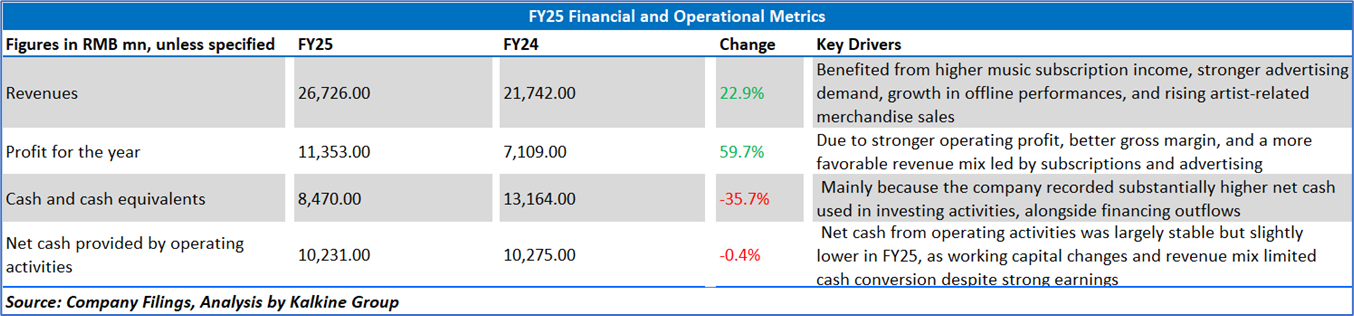
2.2 Insights of FY25:
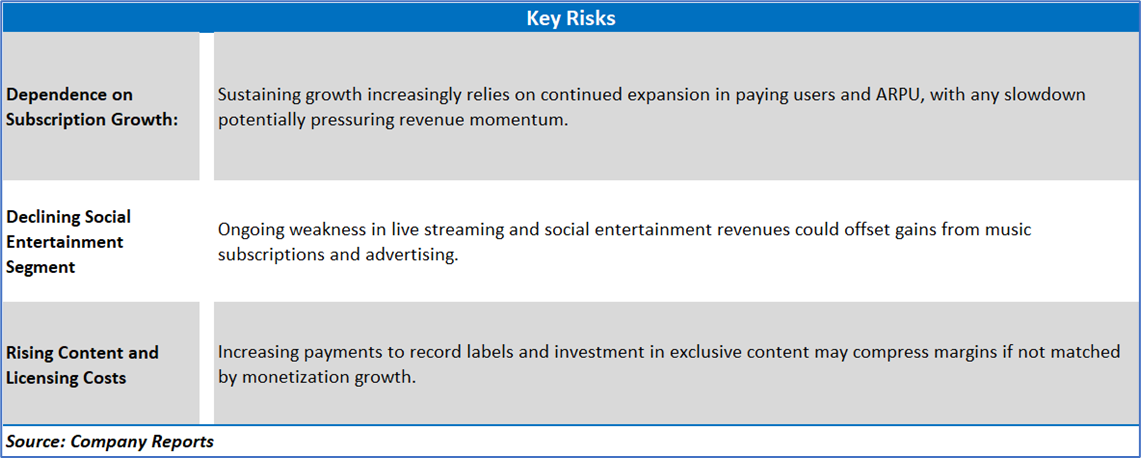
Section 3: Key Risks and Outlook:
Section 4: Stock Recommendation Summary:
4.1 Technical Summary:
Price Performance:
- Trend Structure: The stock has shifted from an earlier uptrend into a sustained downtrend, forming lower highs and lower lows since its peak around August–September.
- Moving Averages: The price is trading below both the 20-day and 50-day moving averages, indicating continued bearish momentum and no clear signs of a near-term reversal.
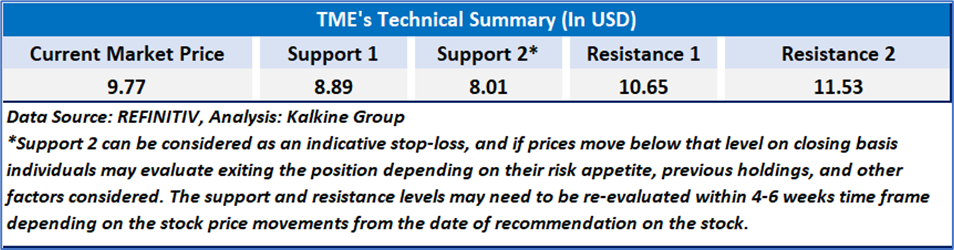
- Resistance Levels: Immediate resistance is around USD 12.9, followed by stronger resistance near USD 14.9, where previous breakdowns occurred.
- Support Levels: The stock is trading close to its recent low near USD 9.7, which serves as a key support level; a break below this may lead to further downside.
- RSI Momentum: The RSI is near 20, indicating oversold conditions, which may support a short-term bounce but does not confirm a reversal.
- Volume Trends: Increased volume during price declines suggests ongoing selling pressure.
4.2 Fundamental Valuation
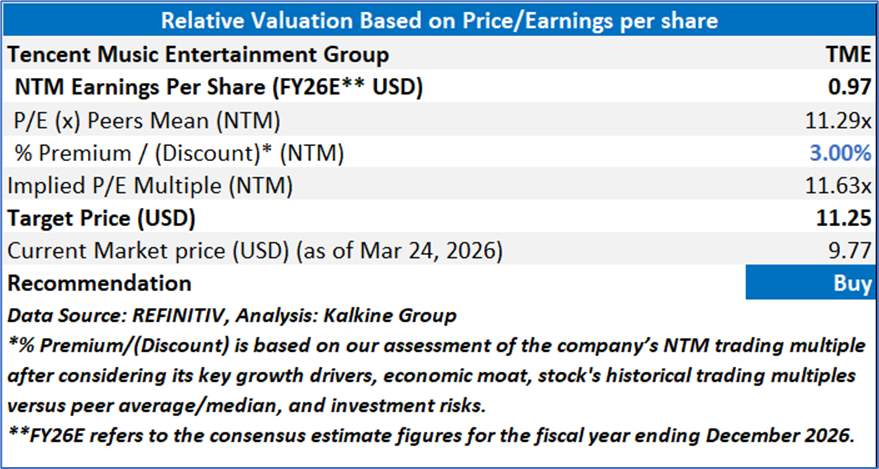
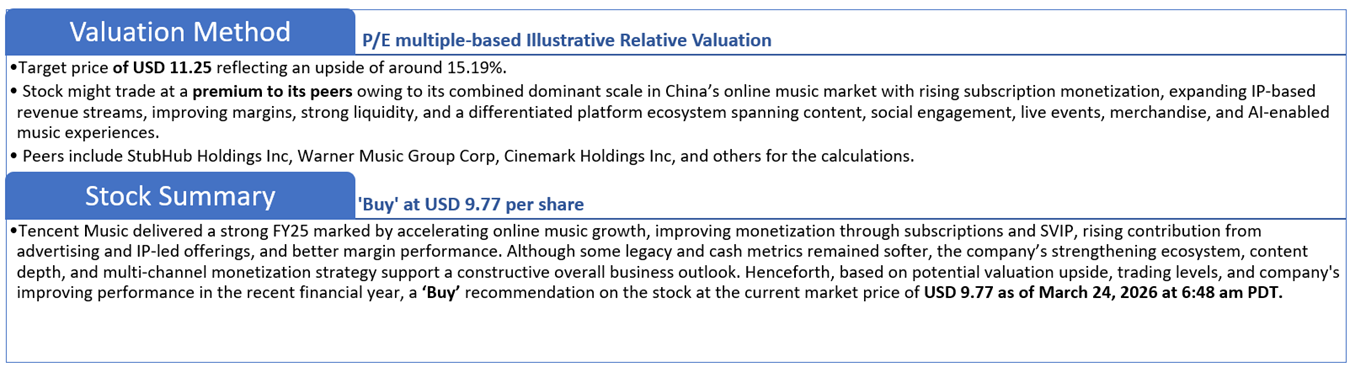
Valuation Methodology: Price/Earnings Per Share Multiple Based Relative Valuation
Markets are trading in a highly volatile zone currently due to certain macroeconomic issues and geopolitical tensions prevailing. Therefore, it is prudent to follow a cautious approach while investing.
Note 1: Past performance is not a reliable indicator of future performance.
Note 2: The reference date for all price data, currency, technical indicators, support, and resistance levels is March 24, 2026. The reference data in this report has been partly sourced from REFINITIV.
Note 3: Investment decisions should be made depending on an individual's appetite for upside potential, risks, holding duration, and any previous holdings. An 'Exit' from the stock can be considered if the Target Price mentioned as per the Valuation and or the technical levels provided has been achieved and is subject to the factors discussed above.
Note 4: The report publishing date is as per the Pacific Time Zone.
Technical Indicators Defined: -
Support: A level at which the stock prices tend to find support if they are falling, and a downtrend may take a pause backed by demand or buying interest. Support 1 refers to the nearby support level for the stock and if the price breaches the level, then Support 2 may act as the crucial support level for the stock.
Resistance: A level at which the stock prices tend to find resistance when they are rising, and an uptrend may take a pause due to profit booking or selling interest. Resistance 1 refers to the nearby resistance level for the stock and if the price surpasses the level, then Resistance 2 may act as the crucial resistance level for the stock.
Stop-loss: It is a level to protect against further losses in case of unfavorable movement in the stock prices.
Past performance is not a reliable indicator of future performance.

 NZ
 UK
 US
 AU
 IND

 CA

 Please wait processing your request...