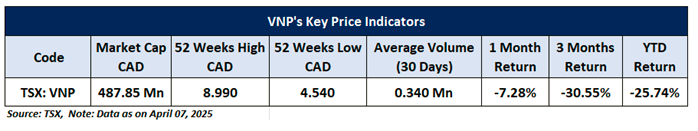
Company Overview: 5N Plus Inc. (TSX: VNP) is a Canadian-based company specializing in the production of specialty metals and chemical products. It operates through two main segments: Electronic Materials and Eco-Friendly Materials. The Electronic Materials division focuses on the manufacturing and sale of high-purity metals, compounds, and alloys used across various electronic applications, including semiconductors, photovoltaics, and medical technologies. This Report covers the Price Action, Technical Indicators Analysis along with the Stop Loss Levels, Target Prices, and Recommendation on this one stock.
Canada Market Round-Up
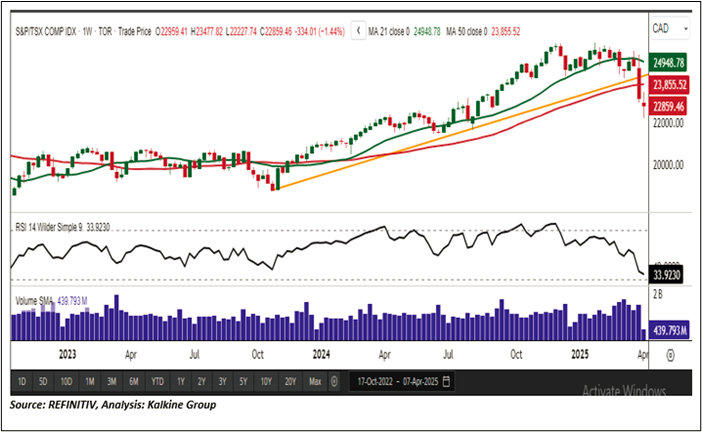
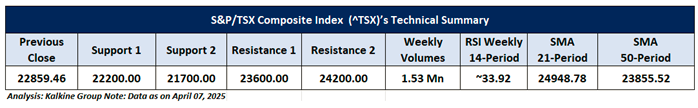
The S&P/TSX Composite Index (TSX: ^TSX) continued its downward trajectory over the past week, closing at 23,193.47 on April 4, 2025, after a sharp decline of 1,565.68 points (-6.32%). The weakness extended into April 7, with the index falling another 334.01 points (-1.44%) to end the session at 22,859.46. Despite the overall decline, select technology and basic materials stocks provided some support, showing relative strength. However, a majority of sectors including consumer non-cyclicals, healthcare, energy, real estate, industrials, consumer cyclicals, financials, and utilities remained laggards, contributing to broader market pressure. On the macroeconomic front, Statistics Canada reported a modest rise in the unemployment rate, up 0.1 percentage points to 6.7%, further dampening sentiment. From a technical standpoint, the index remains under pressure, trading below a key horizontal trendline support zone and firmly beneath the 50-period Simple Moving Average (SMA) which now acts as a significant resistance level. This reinforces the prevailing bearish outlook. Immediate resistance is seen near 23,600, while critical support is situated around 22,200, a level that could serve as a potential pivot for short-term direction. The Relative Strength Index (RSI) on the weekly timeframe is currently around 33.92, hovering near oversold territory.
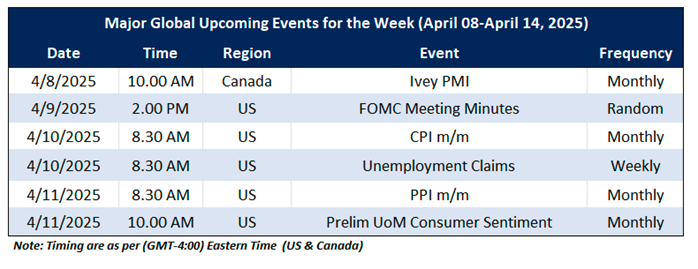
On the macro front, the upcoming major economic events that may impact the Canadian market sentiment include CA Ivey PMI, US CPI m/m and US Unemployment Claims.
Global Markets Wrap-Up
For the week ending April 4, 2025, U.S. equity markets posted sharp declines, with major indices reflecting heightened investor caution and broad-based selling pressure. The Nasdaq Composite dropped approximately 10.02%, closing at 15,587.79, while the Russell 2000 fell around 9.70%, ending the week at 1,827.03 underscoring notable weakness in small-cap stocks. On the economic front, however, there was a modest sign of resilience from the U.S. labor market. According to the U.S. Department of Labor, seasonally adjusted initial jobless claims declined by 6,000, falling to 219,000 for the week ending March 29, down from a revised 225,000 in the previous week.
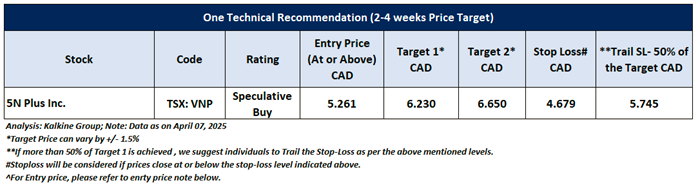
Taking into the US market's performance over the last week, following the major global macros and data front, based on the technical analysis of the S&P/TSX Composite Index, the one TSX listed stock fit the maximum criteria on the technical framework. The recommendations are based on the generic insights, entry price, target prices, and stop-loss for 5N Plus Inc. (TSX: VNP) for the next 2-4 weeks.
5N Plus Inc. (TSX: VNP)
Price Action Analysis (On the Daily Chart)
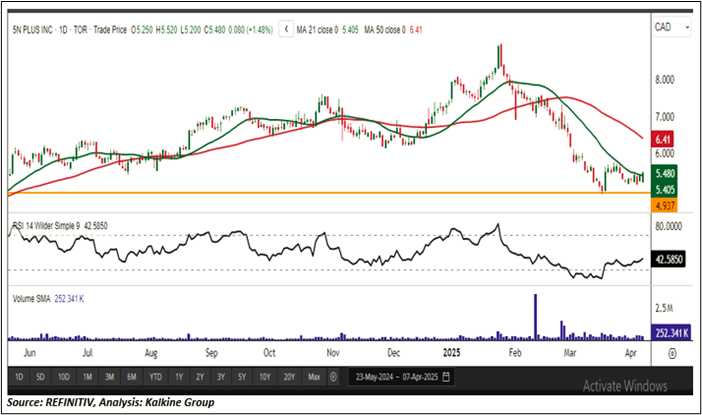
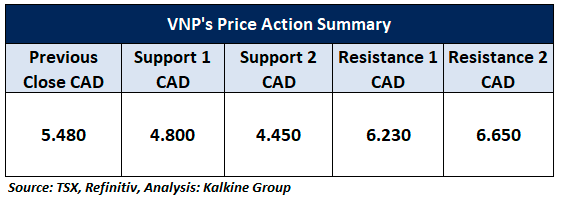
On the daily chart, VNP continues to trade above a key horizontal trendline support, indicating steady buying interest at this critical level. This consistent support has helped maintain the stock's upward structure, attracting positive sentiment from market participants. The recent upward price movement, supported by increasing trading volumes, highlights growing bullish momentum and robust market participation. If this momentum holds over the next 2 to 4 weeks, the stock is well-positioned to test the next resistance level near CAD 6.23. A decisive breakout above CAD 6.23 could confirm a continuation of the uptrend, potentially opening the door for further gains.
Technical Analysis (On the Daily Chart)
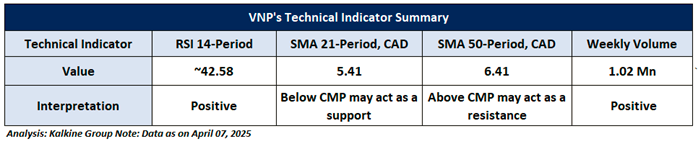
On the daily chart, the 14-period Relative Strength Index (RSI) is hovering around 42.58, showing a rebound from recent lows and suggesting a possible shift in momentum toward the upside. This recovery signals waning bearish pressure and the early signs of renewed strength. Weekly trading volumes remain healthy, supporting the current price trend and indicating consistent buying interest. Moreover, the stock is trading above its 21-period Simple Moving Average (SMA), which now serves as a dynamic support level.
General Recommendation:
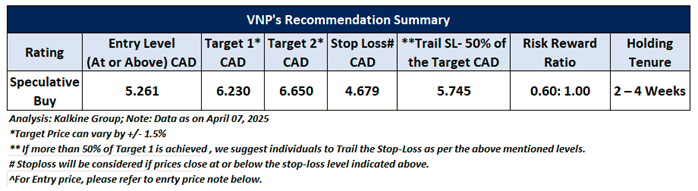
As per the above-mentioned price action and technical analysis, 5N Plus Inc. is looking technically well-placed on the chart, and a ‘Speculative Buy’ recommendation has been given on the stock. Investment decisions should be made depending on an individual’s appetite for upside potential, risks, and any previous holdings. This recommendation is purely based on technical analysis, and fundamental analysis has not been considered in this report. Below is the summary of our recommendation.
Upcoming Major Global Economic Events
Market events occur on a day-to-day basis depending on the frequency of the data and generally include updates on employment, inflation, GDP, consumer sentiments, etc. Noted below are the upcoming week's major global economic events that could impact the S&P/TSX Composite Index and listed stocks' prices.
Related Risks: This report may be looked at from high-risk perspective and recommendations are provided are for a short duration. Recommendations provided in this report are solely based on technical parameters, and the fundamental performance of the stocks has not been considered in the decision-making process. Other factors which could impact the stock prices include market risks, regulatory risks, interest rates risks, currency risks, social and political instability risks etc.
Note 1: Individuals can consider exiting from the stock if the Target Price or Stop loss mentioned as per the technical analysis has been achieved and subject to the factors discussed above.
Note 2: How to Read the Charts?
The Green color line reflects the 21-period moving average, while the Red color line indicates the 50-period moving average. SMA helps to identify existing price trend. If the prices are trading above the 21-period and 50-period moving average, then it shows prices are currently trading in a bullish trend.
The Black color line in the chart's lower segment reflects the Relative Strength Index (14-Period), which indicates price momentum and signals momentum in trend. A reading of 70 or above suggests overbought status, while a reading of 30 or below suggests an oversold status.
The Blue color bars in the chart's lower segment show the volume of the stock. The volume is the number of shares that changed hands during a given day. Stocks with high volumes are more liquid than stocks with lesser volume. Liquidity in stocks helps in easier and faster execution of the order.
The Orange color lines are the trend lines drawn by connecting two or more price points and used for trend identification purposes. The trend line also acts as a line of support and resistance.
Technical Indicators Defined: -
Support: A level at which the stock prices tend to find support if they are falling, and a downtrend may take a pause backed by demand or buying interest. Support 1 refers to the nearby support level for the stock and if the price breaches the level, then Support 2 may act as the crucial support level for the stock.
Resistance: A level at which the stock prices tend to find resistance when they are rising, and an uptrend may take a pause due to profit booking or selling interest. Resistance 1 refers to the nearby resistance level for the stock and if the price surpasses the level, then Resistance 2 may act as the crucial resistance level for the stock.
Stop-loss: It is a level to protect further losses in case of unfavorable movement in the stock prices.
Risk Reward Ratio: The risk reward ratio is the difference between an entry point to a stop loss and profit level. This report is based on ~60% Stop Loss of the Target 1 from the entry point.
A trailing stop-loss is a modification of stop-loss in case of favourable movement in the price to protect the gains. Individuals can Trail the Stop-Loss as per the aforementioned levels if the stock price achieves more than 50% of the Target 1. individuals should consider exiting from the position as per the Trailing Stop-Loss level if the price starts moving downwards after achieving more than 50% of the Target 1.
The reference date for all price data, currency, technical indicators, support, and resistance levels is April 07, 2025. The reference data in this report has been partly sourced from REFINITIV.
Abbreviations
CMP: Current Market Price
SMA: Simple Moving Average
CAD: Canadian Dollar
RSI: Relative Strength Index
Note: Trading decisions require a thorough analysis by individuals. Technical reports in general chart out metrics that may be assessed by individuals before any stock evaluation. The above are illustrative analytical factors used for evaluating the stocks; other parameters can be looked at along with additional risks per se. Past performance is neither an Indicator nor a guarantee of future performance.
Past performance is not a reliable indicator of future performance.

 Please wait processing your request...