Company Overview: AutoCanada Inc. (TSX: ACQ) is a publicly traded Canadian company headquartered in Edmonton, Alberta. Established in 2006, it operates as a multi-location automobile dealership group across North America. Prime Mining Corp. (TSX: PRYM) is a Canadian exploration and development company focused on advancing high-grade gold and silver projects in Mexico. Its flagship asset is the Los Reyes Project, complemented by the Magenta Project. This Report covers the Price Action, Technical Indicators Analysis along with the Stop Loss Levels, Target Prices, and Recommendations on these two stocks.
Canada Market Round-Up
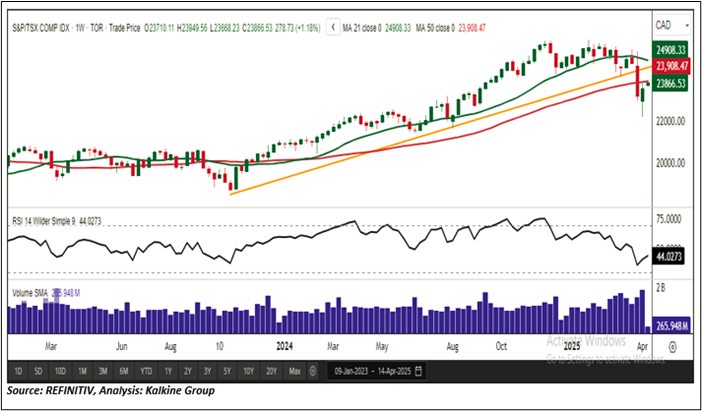
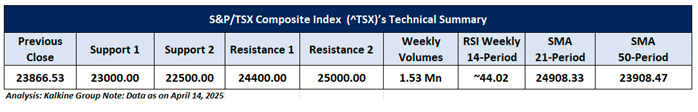
The S&P/TSX Composite Index (TSX: ^TSX) kicked off the previous week with strong bullish momentum, climbing 394.33 points (1.70%) to close at 23,587.80 on April 11, 2025. The rally extended into April 14, with the index advancing another 278.73 points (1.18%) to finish at 23,866.53. The recovery was broad-based, supported by gains across multiple sectors including consumer non-cyclicals, energy, real estate, industrials, consumer cyclicals, basic materials, utilities, technology, and financials. Healthcare was the sole sector to underperform during this period. On the economic front, Statistics Canada reported a 2.9% increase in the total value of building permits for February, rising by $371.3 million to reach $13.1 billion a sign of underlying resilience in the construction and housing sectors. From a technical perspective, despite the recent gains, the index remains below its rising trendline support and the 50-period Simple Moving Average (SMA), indicating that the broader downtrend remains intact amid ongoing short-term volatility. Resistance is seen near the 24,400 level, while key support is located around 23,000. The weekly Relative Strength Index (RSI) stands at 44.02, signalling that momentum is stabilizing, with buyers still active in the market.
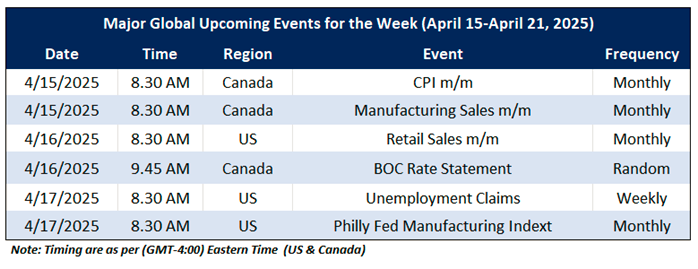
On the macro front, the upcoming major economic events that may impact the Canadian market sentiment include CA CPI m/m, U.S Philly Fed Manufacturing Indext and U.S Unemployment Claims.
Global Markets Wrap-Up
U.S. equities maintained positive momentum during the week ending April 11, 2025, with major indices continuing to climb. The Nasdaq Composite led the advance, surging 7.29% to close at 16,724.46, reflecting strong performance in the technology sector. The Russell 2000, representing small-cap stocks, also posted gains, rising 1.82% to settle at 1,860.20. On the economic front, labor market data revealed a slight increase in unemployment claims. According to the U.S. Department of Labor, initial jobless claims rose by 4,000 to 223,000 for the week ending April 5, 2025, up from 219,000 in the previous week. .
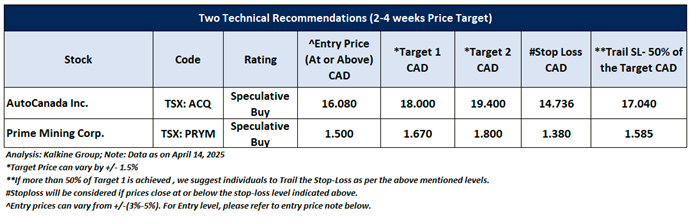
Taking into the US market's performance over the last week, following the major global macros and data front, based on the technical analysis of the S&P/TSX Composite Index, the two TSX listed stocks fit the maximum criteria on the technical framework. The recommendations are based on the generic insights, entry price, target prices, and stop-loss for AutoCanada Inc. (TSX: ACQ) and Prime Mining Corp. (TSX: PRYM) for the next 2-4 weeks.
AutoCanada Inc. (TSX: ACQ)
Price Action Analysis (on the Daily Chart)
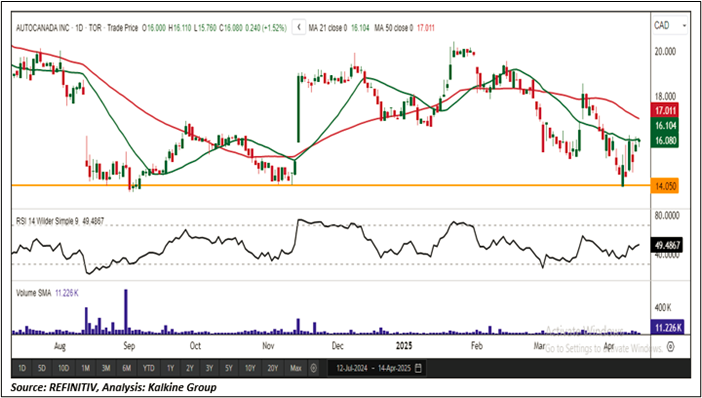
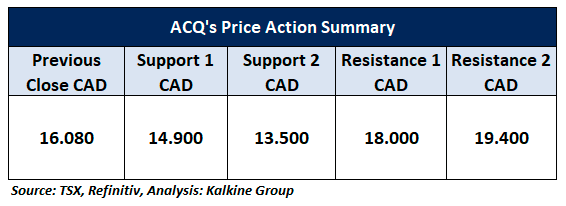
On the daily chart, ACQ is holding above a key horizontal trendline support, confirming the formation of a stable base. The recent upward price movement, accompanied by rising trading volumes, supports a bullish near-term outlook. Over the short term (2–4 weeks), the stock appears poised to test the next resistance level at CAD 18.00. A decisive breakout above this threshold could open the door for further upside. Conversely, maintaining support at current levels would reinforce bullish momentum and suggest continued buying interest.
Technical Analysis (On the Daily Chart)
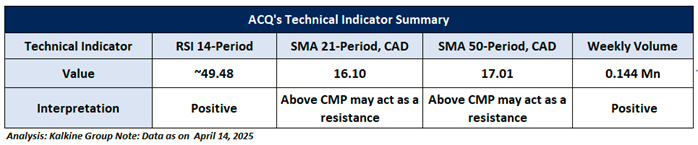
On the daily chart, the 14-period Relative Strength Index (RSI) is currently at approximately 49.48, indicating neutral-to-positive momentum with room for further upside. Additionally, elevated weekly trading volumes reinforce the ongoing uptrend, pointing to sustained buying interest. However, it’s worth noting that the stock is still trading below the 50-period Simple Moving Average (SMA), which may act as a dynamic resistance level in the near term.
General Recommendation:
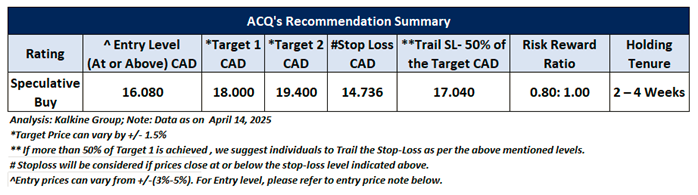
As per the above-mentioned price action and technical analysis, AutoCanada Inc. is looking technically well-placed on the chart, and a ‘Speculative Buy’ recommendation has been given on the stock. Investment decisions should be made depending on an individual’s appetite for upside potential, risks, and any previous holdings.This recommendation is purely based on technical analysis, and fundamental analysis has not been considered in this report. AutoCanada Inc. (TSX: ACQ) was last covered in a report dated '14 March 2023'. Below is the summary of our recommendation.
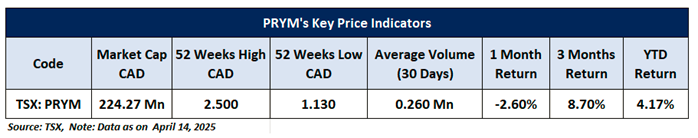
Prime Mining Corp. (TSX: PRYM)
Price Action Analysis (on the Daily Chart)
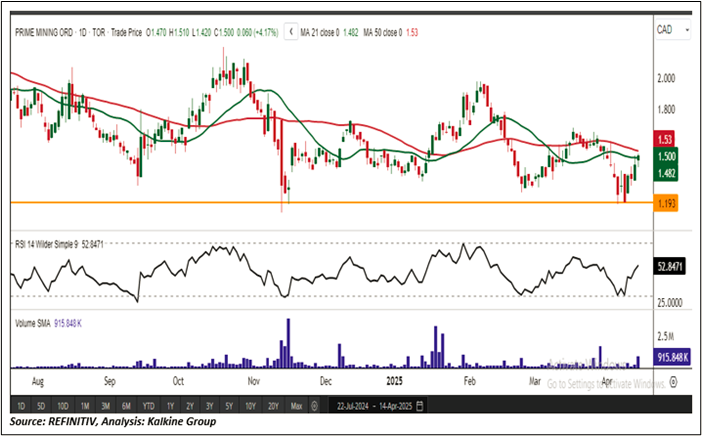
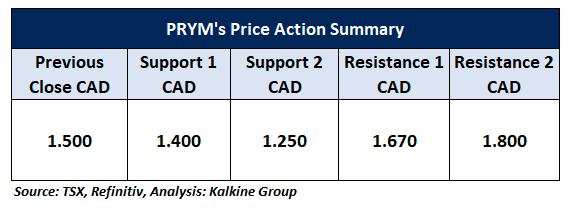
On the daily chart, PRYM is trading above a key horizontal trendline support, consistently holding this zone and confirming it as a reliable base. The recent upward price action, supported by increasing trading volumes, adds conviction to the bullish outlook. In the near term (2–4 weeks), the stock may test the next resistance level at CAD 1.670. A breakout above this threshold could unlock further upside potential, while sustained support at current levels would reinforce the stock’s positive momentum and attract continued buying interest.
Technical Indicators Analysis (On the Daily Chart)
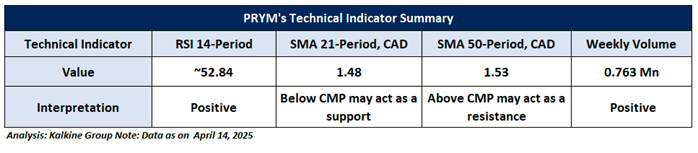
On the daily chart, the 14-period Relative Strength Index (RSI) is currently around 52.84, indicating positive momentum and suggesting that buyers remain in control. The weekly trading volumes continue to support the recent upside, reflecting sustained investor interest. Moreover, the stock is trading above its 21-period Simple Moving Average (SMA), which now acts as a dynamic support level, further reinforcing the bullish technical outlook.
General Recommendation:
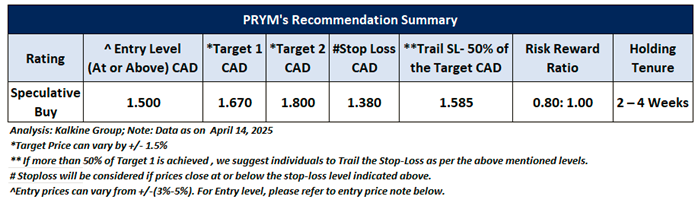
As per the above-mentioned price action and technical analysis, Prime Mining Corp. looking technically well-placed on the chart, and a ‘Speculative Buy’ recommendation has been given on the stock. Investment decisions should be made depending on an individual’s appetite for upside potential, risks, and any previous holdings.This recommendation is purely based on technical analysis, and fundamental analysis has not been considered in this report. Prime Mining Corp. (TSX: PRYM) was last covered in a report dated '19 March 2025'. Below is the summary of our recommendation.
Upcoming Major Global Economic Events
Market events occur on a day-to-day basis depending on the frequency of the data and generally include updates on employment, inflation, GDP, consumer sentiments, etc. Noted below are the upcoming week's major global economic events that could impact the S&P/TSX Composite Index and listed stocks' prices.
Related Risks: This report may be looked at from high-risk perspective and recommendations are provided are for a short duration. Recommendations provided in this report are solely based on technical parameters, and the fundamental performance of the stocks has not been considered in the decision-making process. Other factors which could impact the stock prices include market risks, regulatory risks, interest rates risks, currency risks, social and political instability risks etc.
Markets are trading in a highly volatile zone currently due to certain macro-economic issues and geopolitical tensions prevailing. Therefore, it is prudent to follow a cautious approach while investing.
Note 1: Individuals can consider exiting from the stock if the Target Price or Stop loss mentioned as per the technical analysis has been achieved and subject to the factors discussed above.
Note 2: How to Read the Charts?
The Green color line reflects the 21-period moving average, while the Red color line indicates the 50-period moving average. SMA helps to identify existing price trend. If the prices are trading above the 21-period and 50-period moving average, then it shows prices are currently trading in a bullish trend.
The Black color line in the chart's lower segment reflects the Relative Strength Index (14-Period), which indicates price momentum and signals momentum in trend. A reading of 70 or above suggests overbought status, while a reading of 30 or below suggests an oversold status.
The Blue color bars in the chart's lower segment show the volume of the stock. The volume is the number of shares that changed hands during a given day. Stocks with high volumes are more liquid than stocks with lesser volume. Liquidity in stocks helps in easier and faster execution of the order.
The Orange color lines are the trend lines drawn by connecting two or more price points and used for trend identification purposes. The trend line also acts as a line of support and resistance.
Technical Indicators Defined: -
Support: A level at which the stock prices tend to find support if they are falling, and a downtrend may take a pause backed by demand or buying interest. Support 1 refers to the nearby support level for the stock and if the price breaches the level, then Support 2 may act as the crucial support level for the stock.
Resistance: A level at which the stock prices tend to find resistance when they are rising, and an uptrend may take a pause due to profit booking or selling interest. Resistance 1 refers to the nearby resistance level for the stock and if the price surpasses the level, then Resistance 2 may act as the crucial resistance level for the stock.
Stop-loss: It is a level to protect further losses in case of unfavourable movement in the stock prices.
Risk Reward Ratio: The risk reward ratio is the difference between an entry point to a stop loss and profit level. This report is based on ~80% Stop Loss of the Target 1 from the entry point.
A trailing stop-loss is a modification of stop-loss in case of favourable movement in the price to protect the gains. Individuals can Trail the Stop-Loss as per the aforementioned levels if the stock price achieves more than 50% of the Target 1. individuals should consider exiting from the position as per the Trailing Stop-Loss level if the price starts moving downwards after achieving more than 50% of the Target 1.
The reference date for all price data, currency, technical indicators, support, and resistance levels is April 14, 2025. The reference data in this report has been partly sourced from REFINITIV.
Abbreviations
CMP: Current Market Price
SMA: Simple Moving Average
CAD: Canadian Dollar
RSI: Relative Strength Index
Note: Trading decisions require a thorough analysis by individuals. Technical reports in general chart out metrics that may be assessed by individuals before any stock evaluation. The above are illustrative analytical factors used for evaluating the stocks; other parameters can be looked at along with additional risks per se. Past performance is neither an indicator nor a guarantee of future performance.
Past performance is not a reliable indicator of future performance.

 Please wait processing your request...