Company Overview: ATS Corporation (TSX: ATS) specializes in the planning, design, construction, commissioning, and servicing of automated manufacturing and assembly systems. The company delivers advanced automation solutions across a range of industries, helping clients improve productivity, precision, and operational efficiency. Bitfarms Ltd. (TSX: BITF) is a publicly traded, global bitcoin mining company focused on vertically integrated operations. The company develops, owns, and operates mining farms while managing all aspects in-house including electrical engineering, equipment installation, and maintenance. This Report covers the Price Action, Technical Indicators Analysis along with the Stop Loss Levels, Target Prices, and Recommendations on these two stocks.
Canada Market Round-Up
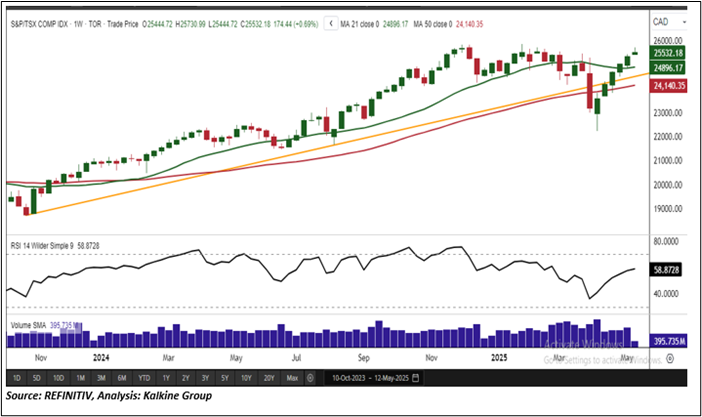
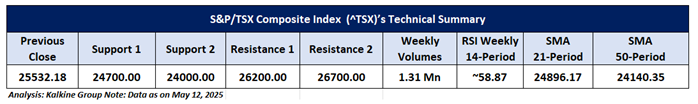
The S&P/TSX Composite Index (TSX: ^TSX) began the previous week with strong bullish momentum, gaining 326.23 points (+1.30%) to close at 25,357.74 on May 9, 2025. The upward trend extended into May 12, with the index rising another 174.44 points (+0.69%) to finish at 25,532.18. The rally was broad-based, driven by notable strength in sectors such as technology, healthcare, energy, real estate, industrials, consumer cyclicals, and financials. In contrast, basic materials, utilities, and consumer non-cyclicals underperformed during the same period. On the macroeconomic front, Statistics Canada reported an increase in the unemployment rate, which rose by 0.2 percentage points to 6.9% in April, potentially signaling some labor market softness. From a technical standpoint, the index remains above both its rising trendline support and the 21-period Simple Moving Average (SMA), reinforcing the continuation of the broader uptrend despite near-term fluctuations. Resistance is observed near the 26,200 level, while key support is anchored around 24,700. The weekly Relative Strength Index (RSI) stands at 58.87, suggesting stabilizing momentum with underlying buying interest still present.
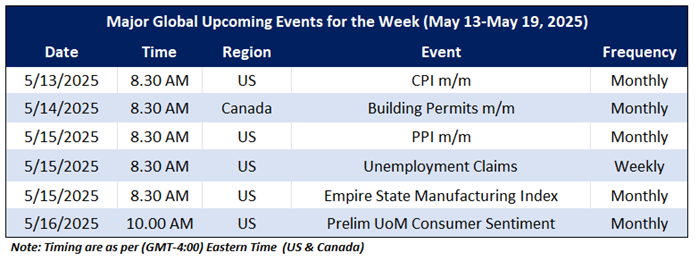
On the macro front, the upcoming major economic events that may impact the Canadian market sentiment include CA Building Permits m/m, U.S PPI m/m and U.S Unemployment Claims.
Global Markets Wrap-Up
U.S. equities showed softer momentum during the week ending May 9, 2025, with major indices experiencing mixed performance. The Nasdaq Composite slipped 0.27% to close at 17,928.92, weighed down by weakness in the technology sector. Meanwhile, the Russell 2000, which tracks small-cap stocks, edged higher by 0.12%, finishing at 2,023.07, showing relative resilience. The U.S. Department of Labor reported a decline in seasonally adjusted initial jobless claims, which fell by 13,000 to 228,000 for the week ending May 3, down from the previous week's revised total of 241,000. .
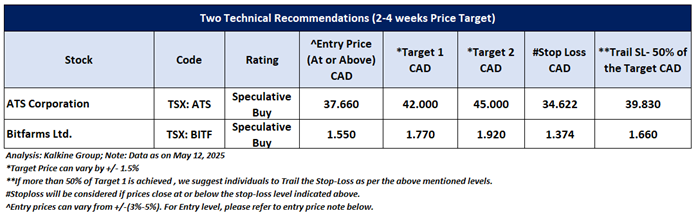
Taking into the US market's performance over the last week, following the major global macros and data front, based on the technical analysis of the S&P/TSX Composite Index, the two TSX listed stocks fit the maximum criteria on the technical framework. The recommendations are based on the generic insights, entry price, target prices, and stop-loss for ATS Corporation (TSX: ATS) and Bitfarms Ltd. (TSX: BITF) for the next 2-4 weeks.
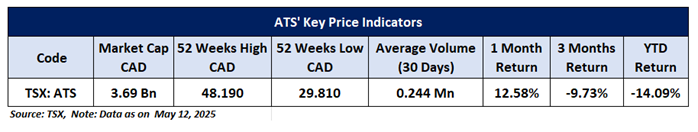
ATS Corporation (TSX: ATS)
Price Action Analysis (on the Daily Chart)
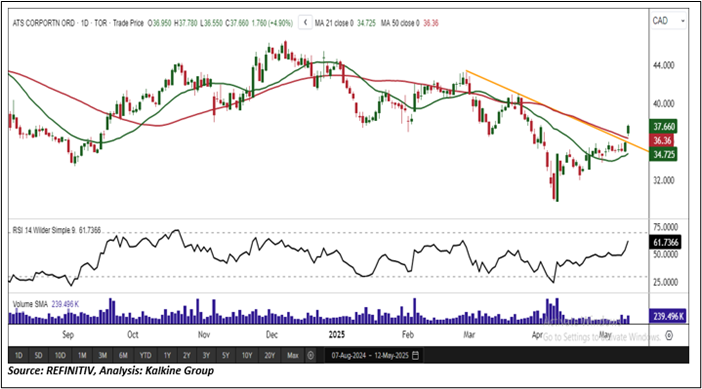
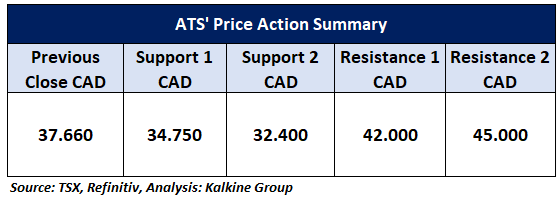
On the daily chart, ATS is holding above a key descending trendline support, indicating the formation of a stable base. Recent upward price action accompanied by rising trading volumes strengthens the near-term bullish outlook. Over the next 2 to 4 weeks, the stock appears poised to test the next resistance level at CAD 42.00. A decisive breakout above this threshold could open the door to additional upside momentum, potentially establishing a new leg higher in the prevailing trend.
Technical Analysis (On the Daily Chart)
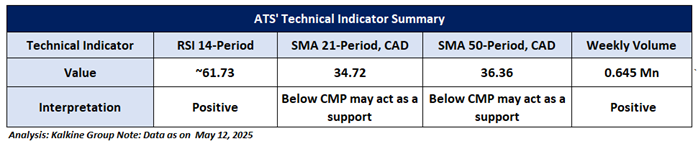
On the daily chart, the 14-period Relative Strength Index (RSI) is hovering around 61.73, reflecting positive momentum and indicating that buyers remain in control. Weekly trading volumes continue to support the recent upward move, underscoring sustained investor interest. Additionally, the stock is trading above its 21-period Simple Moving Average (SMA), which now acts as dynamic support further reinforcing the bullish technical outlook.
General Recommendation:
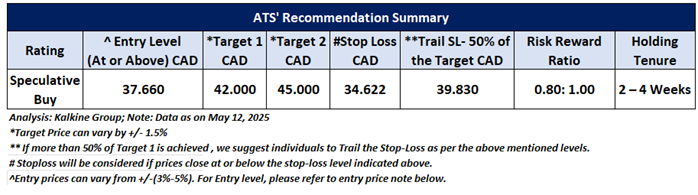
As per the above-mentioned price action and technical analysis, ATS Corporation is looking technically well-placed on the chart, and a ‘Speculative Buy’ recommendation has been given on the stock. Investment decisions should be made depending on an individual’s appetite for upside potential, risks, and any previous holdings.This recommendation is purely based on technical analysis, and fundamental analysis has not been considered in this report. ATS Corporation (TSX: ATS) was last covered in a report dated '07 March 2025'. Below is the summary of our recommendation.
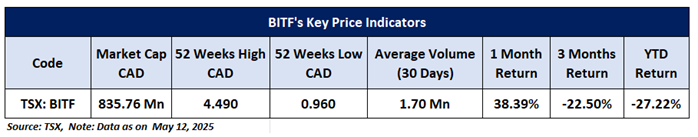
Bitfarms Ltd. (TSX: BITF)
Price Action Analysis (on the Daily Chart)
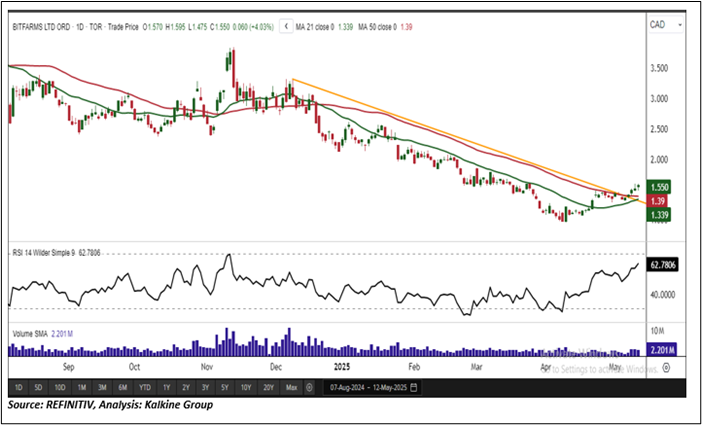
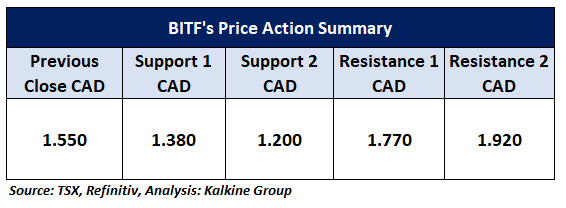
On the daily chart, BITF is trading above a key falling trendline support, consistently holding this zone and confirming it as a reliable base. The recent upward price action accompanied by rising trading volumes strengthens the bullish outlook and suggests increasing investor confidence. In the near term (2–4 weeks), the stock appears positioned to challenge the next resistance level at CAD 1.77. A breakout above this level could unlock further upside potential. Meanwhile, continued support at current levels would reinforce the stock’s positive momentum and likely attract sustained buying interest.
Technical Indicators Analysis (On the Daily Chart)
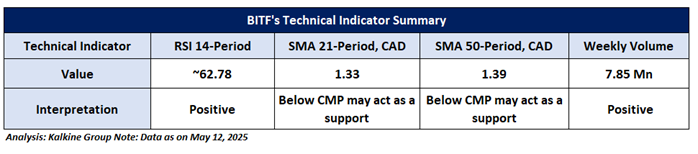
On the daily chart, the 14-period Relative Strength Index (RSI) stands at approximately 62.78, signaling positive momentum and suggesting that buyers remain firmly in control. Weekly trading volumes continue to support the recent upside move, indicating sustained investor interest. Additionally, the stock is trading above its 21-period Simple Moving Average (SMA), which now serves as dynamic support further strengthening the bullish technical outlook.
General Recommendation:
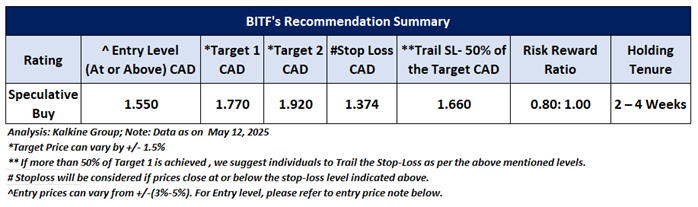
As per the above-mentioned price action and technical analysis, Bitfarms Ltd. looking technically well-placed on the chart, and a ‘Speculative Buy’ recommendation has been given on the stock. Investment decisions should be made depending on an individual’s appetite for upside potential, risks, and any previous holdings.This recommendation is purely based on technical analysis, and fundamental analysis has not been considered in this report. Bitfarms Ltd. (TSX: BITF) was last covered in a report dated '17 March 2025'. Below is the summary of our recommendation.
Upcoming Major Global Economic Events
Market events occur on a day-to-day basis depending on the frequency of the data and generally include updates on employment, inflation, GDP, consumer sentiments, etc. Noted below are the upcoming week's major global economic events that could impact the S&P/TSX Composite Index and listed stocks' prices.
Related Risks: This report may be looked at from high-risk perspective and recommendations are provided are for a short duration. Recommendations provided in this report are solely based on technical parameters, and the fundamental performance of the stocks has not been considered in the decision-making process. Other factors which could impact the stock prices include market risks, regulatory risks, interest rates risks, currency risks, social and political instability risks etc.
Markets are trading in a highly volatile zone currently due to certain macro-economic issues and geopolitical tensions prevailing. Therefore, it is prudent to follow a cautious approach while investing.
Note 1: Individuals can consider exiting from the stock if the Target Price or Stop loss mentioned as per the technical analysis has been achieved and subject to the factors discussed above.
Note 2: How to Read the Charts?
The Green color line reflects the 21-period moving average, while the Red color line indicates the 50-period moving average. SMA helps to identify existing price trend. If the prices are trading above the 21-period and 50-period moving average, then it shows prices are currently trading in a bullish trend.
The Black color line in the chart's lower segment reflects the Relative Strength Index (14-Period), which indicates price momentum and signals momentum in trend. A reading of 70 or above suggests overbought status, while a reading of 30 or below suggests an oversold status.
The Blue color bars in the chart's lower segment show the volume of the stock. The volume is the number of shares that changed hands during a given day. Stocks with high volumes are more liquid than stocks with lesser volume. Liquidity in stocks helps in easier and faster execution of the order.
The Orange color lines are the trend lines drawn by connecting two or more price points and used for trend identification purposes. The trend line also acts as a line of support and resistance.
Technical Indicators Defined: -
Support: A level at which the stock prices tend to find support if they are falling, and a downtrend may take a pause backed by demand or buying interest. Support 1 refers to the nearby support level for the stock and if the price breaches the level, then Support 2 may act as the crucial support level for the stock.
Resistance: A level at which the stock prices tend to find resistance when they are rising, and an uptrend may take a pause due to profit booking or selling interest. Resistance 1 refers to the nearby resistance level for the stock and if the price surpasses the level, then Resistance 2 may act as the crucial resistance level for the stock.
Stop-loss: It is a level to protect further losses in case of unfavourable movement in the stock prices.
Risk Reward Ratio: The risk reward ratio is the difference between an entry point to a stop loss and profit level. This report is based on ~80% Stop Loss of the Target 1 from the entry point.
A trailing stop-loss is a modification of stop-loss in case of favourable movement in the price to protect the gains. Individuals can Trail the Stop-Loss as per the aforementioned levels if the stock price achieves more than 50% of the Target 1. individuals should consider exiting from the position as per the Trailing Stop-Loss level if the price starts moving downwards after achieving more than 50% of the Target 1.
The reference date for all price data, currency, technical indicators, support, and resistance levels is May 12, 2025. The reference data in this report has been partly sourced from REFINITIV.
Abbreviations
CMP: Current Market Price
SMA: Simple Moving Average
CAD: Canadian Dollar
RSI: Relative Strength Index
Note: Trading decisions require a thorough analysis by individuals. Technical reports in general chart out metrics that may be assessed by individuals before any stock evaluation. The above are illustrative analytical factors used for evaluating the stocks; other parameters can be looked at along with additional risks per se. Past performance is neither an indicator nor a guarantee of future performance.
Past performance is not a reliable indicator of future performance.

 Please wait processing your request...