Company Overview: Ballard Power Systems Inc. (TSX: BLDP) is a global leader in proton exchange membrane (PEM) fuel cell technology, specializing in the design, development, manufacture, sale, and servicing of PEM fuel cell products. Patriot Battery Metals Inc. (TSX: PMET) is a Canadian hard-rock lithium exploration company focused on advancing its 100%-owned, district-scale Corvette Property, located in the Eeyou Istchee James Bay region of Quebec. This Report covers the Price Action, Technical Indicators Analysis along with the Stop Loss Levels, Target Prices, and Recommendations on these two stocks.
Canada Market Round-Up
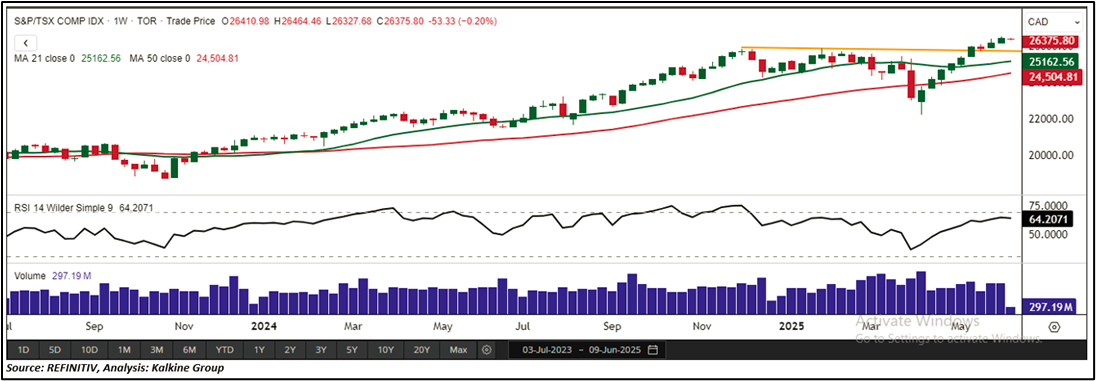
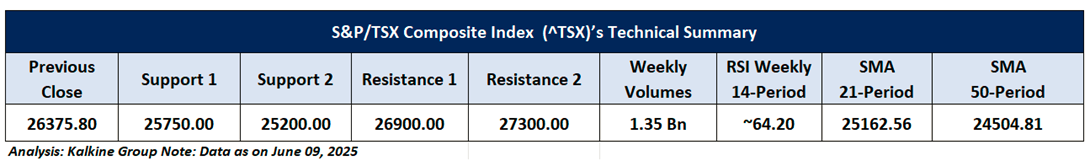
The S&P/TSX Composite Index (TSX: ^TSX) delivered a positive performance last week, gaining 254.08 points (+0.97%) to close at 26,429.13. However, on June 9, the index slipped by 53.33 points (–0.20%). Sector-wise, base metals, healthcare, energy, utilities, and telecom posted notable gains, while industrials, technology, and select financial stocks underperformed the broader market. On the macroeconomic front, Statistics Canada reported a slight uptick in the national unemployment rate, which rose by 0.1 percentage points to 7.0%. Technically, the index remains above both its horizontal trendline and the 50-period Simple Moving Average (SMA), supporting the continuation of the current uptrend. Key resistance is observed near 26,900, while support is identified around 25,750. The weekly Relative Strength Index (RSI) stands at 64.20, reflecting steady momentum and sustained buying interest.
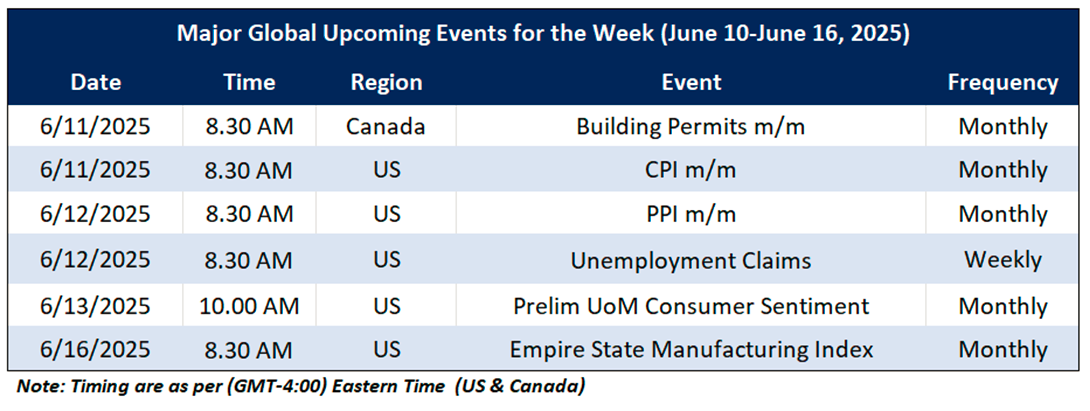
On the macro front, the upcoming major economic events that may impact the Canadian market sentiment include CA Building Permits m/m, U.S CPI m/m and U.S Unemployment Claims.
Global Markets Wrap-Up
U.S. stock markets continued to exhibit strong bullish momentum during the week ending June 06, 2025, with major indices posting solid gains. The Nasdaq Composite advanced 2.18%, closing at 19,529.95, fueled by sustained strength in the technology sector. Meanwhile, the Russell 2000, which represents small-cap stocks, rose 3.19% to finish at 2,132.25, reflecting ongoing resilience among smaller companies. On the economic front, the U.S. Department of Labor reported a slight rise in unemployment claims. For the week ending May 31, initial jobless claims increased by 8,000 to 247,000, up from a revised 239,000 the previous week. .
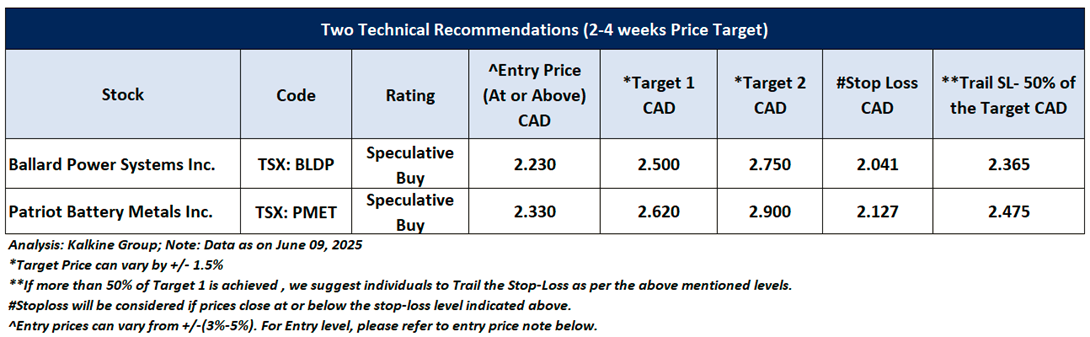
Taking into the US market's performance over the last week, following the major global macros and data front, based on the technical analysis of the S&P/TSX Composite Index, the two TSX listed stocks fit the maximum criteria on the technical framework. The recommendations are based on the generic insights, entry price, target prices, and stop-loss for Ballard Power Systems Inc. (TSX: BLDP) and Patriot Battery Metals Inc. (TSX: PMET) for the next 2-4 weeks.
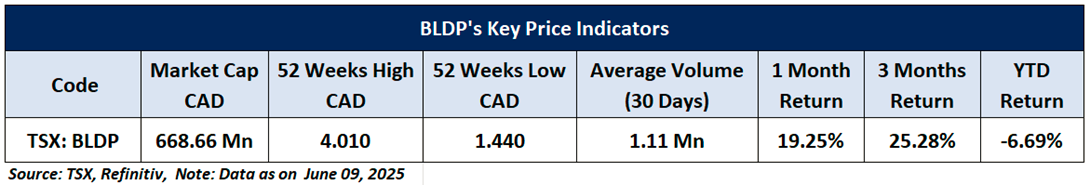
Ballard Power Systems Inc. (TSX: BLDP)
Price Action Analysis (on the Daily Chart)
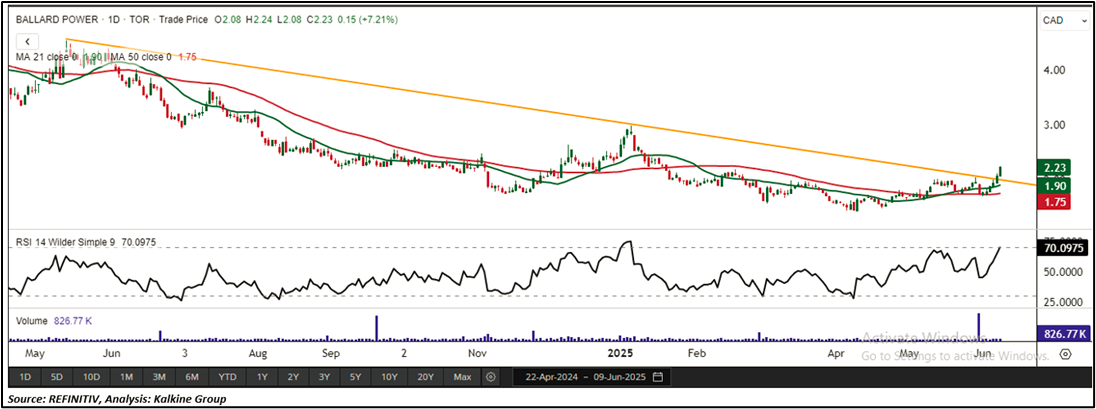
On the daily chart, BLDP is holding above a key falling trendline breakout level, indicating the formation of a stable technical base. This structural support reflects underlying strength in the current trend. The recent upward price action, accompanied by increasing trading volumes, strengthens the near-term bullish outlook and highlights growing investor interest. Over the next 2 to 4 weeks, the stock appears poised to test the next resistance level at CAD 2.50. A decisive breakout above this threshold could signal the beginning of a fresh upward leg, potentially unlocking further momentum-driven gains within the existing trend.
Technical Analysis (On the Daily Chart)
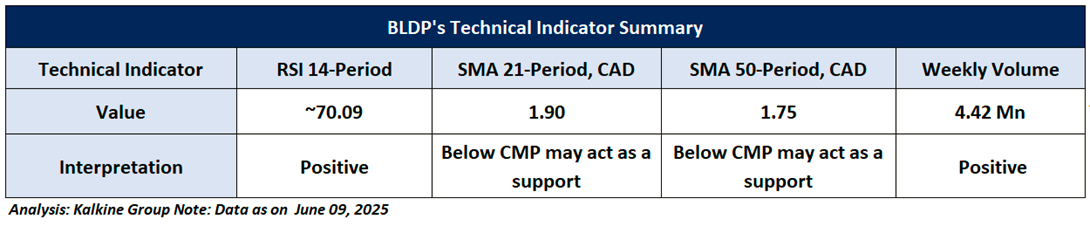
On the daily chart, the 14-period Relative Strength Index (RSI) is hovering around 70.09, indicating strong positive momentum. Weekly trading volumes continue to support the recent upward price movement, reflecting sustained investor interest. Additionally, the stock is trading above its 50-period Simple Moving Average (SMA), which is now serving as dynamic support further reinforcing the bullish technical outlook.
General Recommendation:
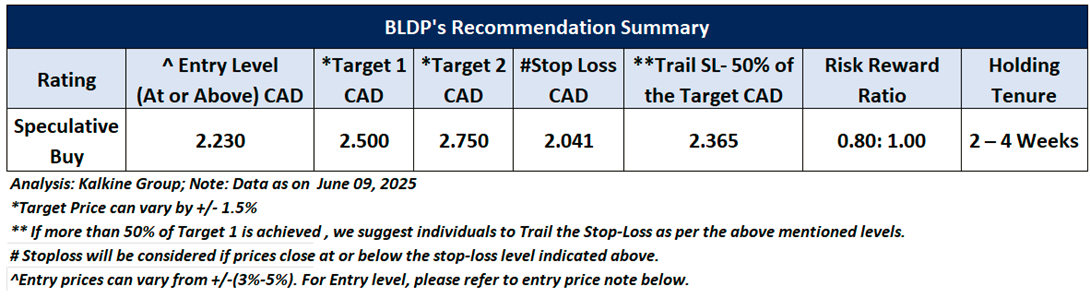
As per the above-mentioned price action and technical analysis, Ballard Power Systems Inc. is looking technically well-placed on the chart, and a ‘Speculative Buy’ recommendation has been given on the stock. Investment decisions should be made depending on an individual’s appetite for upside potential, risks, and any previous holdings.This recommendation is purely based on technical analysis, and fundamental analysis has not been considered in this report. Ballard Power Systems Inc. (TSX: BLDP) was last covered in a report dated '18 July 2023'. Below is the summary of our recommendation.
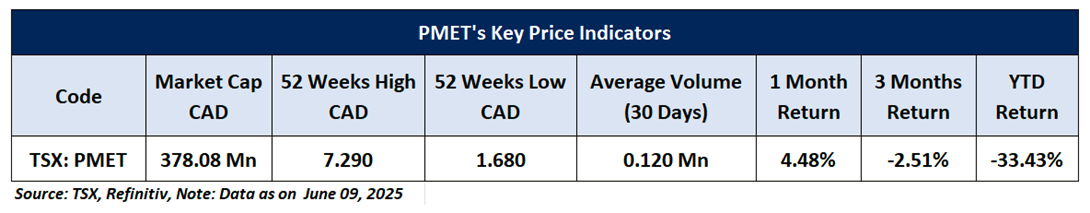
Patriot Battery Metals Inc. (TSX: PMET)
Price Action Analysis (On the Daily Chart)
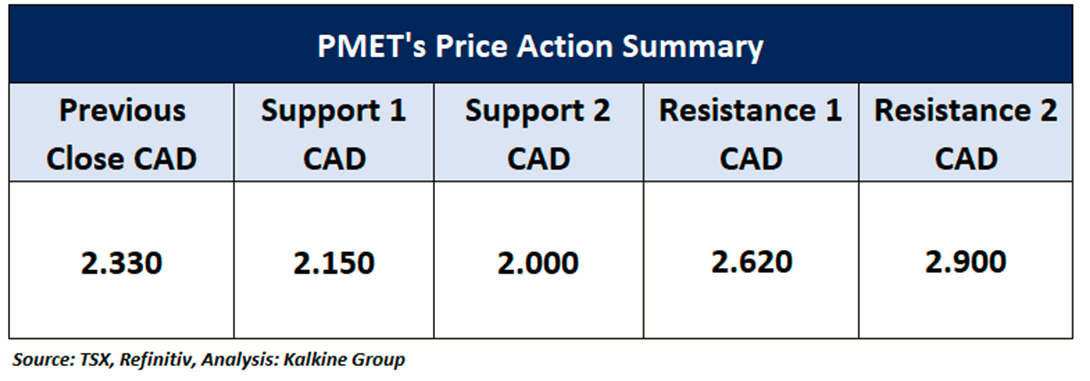
On the daily chart, PMET is trading firmly above a key descending trendline, which has now transitioned into a reliable support zone. The stock’s ability to maintain this level highlights strengthening technical momentum. Recent upward price action, backed by rising trading volumes, signals growing investor confidence and reinforces the bullish outlook. In the near term (2–4 weeks), PMET appears well-positioned to challenge the next resistance level at CAD 2.62. A decisive breakout above this threshold could pave the way for additional upside potential.
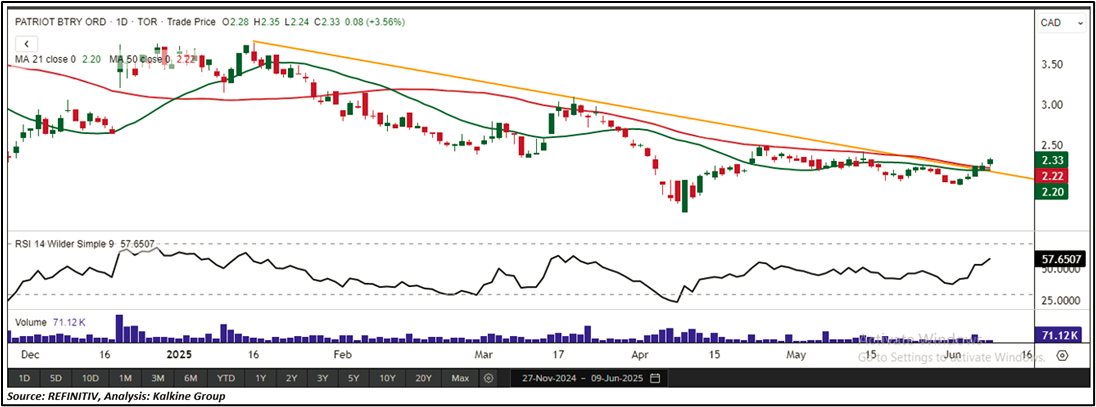
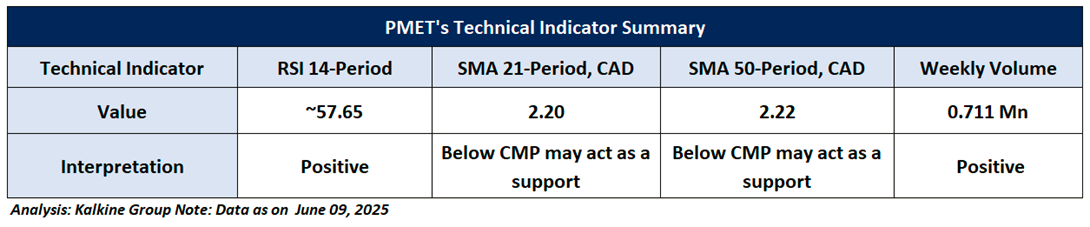
Technical Indicators Analysis (On the Daily Chart)
On the daily chart, the 14-period Relative Strength Index (RSI) is currently at approximately 57.65, reflecting positive momentum and indicating that buyers remain in control of the trend. Weekly trading volumes continue to align with the recent upside, reinforcing sustained investor interest and supporting the strength of the move. Moreover, the stock is trading above its 21-period Simple Moving Average (SMA), which now acts as dynamic support, adding further credibility to the bullish technical setup.
General Recommendation:
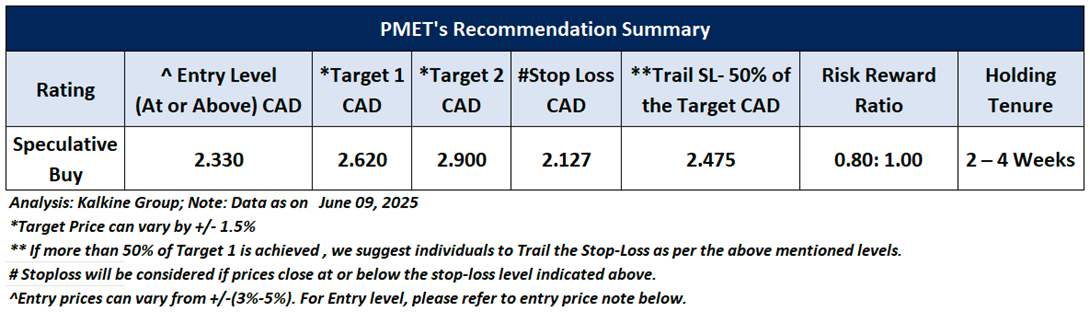
As per the above-mentioned price action and technical analysis, Patriot Battery Metals Inc. looking technically well-placed on the chart, and a ‘Speculative Buy’ recommendation has been given on the stock. Investment decisions should be made depending on an individual’s appetite for upside potential, risks, and any previous holdings.This recommendation is purely based on technical analysis, and fundamental analysis has not been considered in this report. Patriot Battery Metals Inc. (TSX: PMET) was last covered in a report dated '04 May 2022'. Below is the summary of our recommendation.
Upcoming Major Global Economic Events
Market events occur on a day-to-day basis depending on the frequency of the data and generally include updates on employment, inflation, GDP, consumer sentiments, etc. Noted below are the upcoming week's major global economic events that could impact the S&P/TSX Composite Index and listed stocks' prices.
Related Risks: This report may be looked at from high-risk perspective and recommendations are provided are for a short duration. Recommendations provided in this report are solely based on technical parameters, and the fundamental performance of the stocks has not been considered in the decision-making process. Other factors which could impact the stock prices include market risks, regulatory risks, interest rates risks, currency risks, social and political instability risks etc.
Markets are trading in a highly volatile zone currently due to certain macro-economic issues and geopolitical tensions prevailing. Therefore, it is prudent to follow a cautious approach while investing.
Note 1: Individuals can consider exiting from the stock if the Target Price or Stop loss mentioned as per the technical analysis has been achieved and subject to the factors discussed above.
Note 2: How to Read the Charts?
The Green color line reflects the 21-period moving average, while the Red color line indicates the 50-period moving average. SMA helps to identify existing price trend. If the prices are trading above the 21-period and 50-period moving average, then it shows prices are currently trading in a bullish trend.
The Black color line in the chart's lower segment reflects the Relative Strength Index (14-Period), which indicates price momentum and signals momentum in trend. A reading of 70 or above suggests overbought status, while a reading of 30 or below suggests an oversold status.
The Blue color bars in the chart's lower segment show the volume of the stock. The volume is the number of shares that changed hands during a given day. Stocks with high volumes are more liquid than stocks with lesser volume. Liquidity in stocks helps in easier and faster execution of the order.
The Orange color lines are the trend lines drawn by connecting two or more price points and used for trend identification purposes. The trend line also acts as a line of support and resistance.
Technical Indicators Defined: -
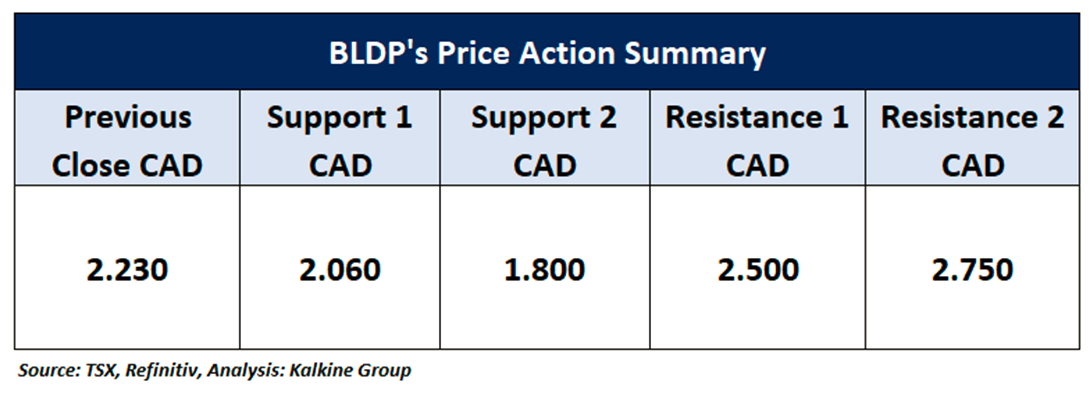
Support: A level at which the stock prices tend to find support if they are falling, and a downtrend may take a pause backed by demand or buying interest. Support 1 refers to the nearby support level for the stock and if the price breaches the level, then Support 2 may act as the crucial support level for the stock.
Resistance: A level at which the stock prices tend to find resistance when they are rising, and an uptrend may take a pause due to profit booking or selling interest. Resistance 1 refers to the nearby resistance level for the stock and if the price surpasses the level, then Resistance 2 may act as the crucial resistance level for the stock.
Stop-loss: It is a level to protect further losses in case of unfavourable movement in the stock prices.
Risk Reward Ratio: The risk reward ratio is the difference between an entry point to a stop loss and profit level. This report is based on ~80% Stop Loss of the Target 1 from the entry point.
A trailing stop-loss is a modification of stop-loss in case of favourable movement in the price to protect the gains. Individuals can Trail the Stop-Loss as per the aforementioned levels if the stock price achieves more than 50% of the Target 1. individuals should consider exiting from the position as per the Trailing Stop-Loss level if the price starts moving downwards after achieving more than 50% of the Target 1.
The reference date for all price data, currency, technical indicators, support, and resistance levels is June 09, 2025. The reference data in this report has been partly sourced from REFINITIV.
Abbreviations
CMP: Current Market Price
SMA: Simple Moving Average
CAD: Canadian Dollar
RSI: Relative Strength Index
Note: Trading decisions require a thorough analysis by individuals. Technical reports in general chart out metrics that may be assessed by individuals before any stock evaluation. The above are illustrative analytical factors used for evaluating the stocks; other parameters can be looked at along with additional risks per se. Past performance is neither an indicator nor a guarantee of future performance.
Past performance is not a reliable indicator of future performance.

 Please wait processing your request...