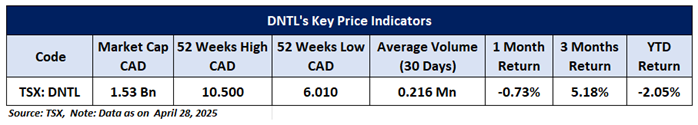
Company Overview: Dentalcorp Holdings Ltd. (TSX: DNTL) operates in the Canadian healthcare sector, focusing on the acquisition of dental practices and the delivery of dental services. The company recognizes revenue from dental procedures performed by partner dentists and practitioners contracted through Professional Corporations, as well as from healthcare services provided by its employees or independent contractors. Cineplex Inc. (TSX: CGX) is a diversified media and entertainment company primarily known for operating a nationwide chain of movie theatres. This Report covers the Price Action, Technical Indicators Analysis along with the Stop Loss Levels, Target Prices, and Recommendations on these two stocks.
Canada Market Round-Up
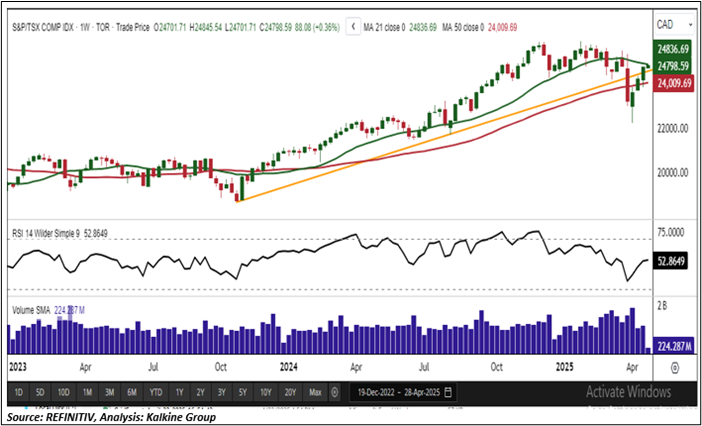
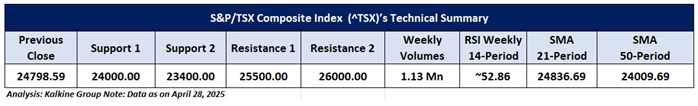
The S&P/TSX Composite Index (TSX: ^TSX) started the previous week with strong bullish momentum, surging 517.70 points (2.14%) to close at 24,710.51 on April 25, 2025. The rally continued into April 28, with the index gaining an additional 88.08 points (0.36%) to settle at 24,798.59. The recovery was broad-based, with notable strength across sectors such as technology, energy, consumer non-cyclicals, consumer cyclicals, basic materials, utilities, and financials. Conversely, real estate, industrials, and healthcare sectors underperformed during this period. On the economic front, Statistics Canada reported a 0.4% decline in retail sales to $69.3 billion for February. Technically, the index remains above its rising trendline support and the 21-period Simple Moving Average (SMA), suggesting the broader uptrend is intact despite short-term volatility. Resistance is identified near the 25,500 level, while key support lies around 24,000. The weekly Relative Strength Index (RSI) stands at 52.86, indicating that momentum is stabilizing, with buying activity still present in the market.
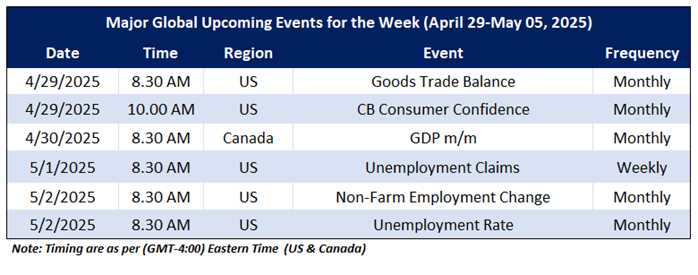
On the macro front, the upcoming major economic events that may impact the Canadian market sentiment include CA GDP m/m, U.S Non-Farm Employment Change and U.S Unemployment Claims.
Global Markets Wrap-Up
U.S. equities sustained their upward momentum during the week ending April 25, 2025, with major indices posting notable gains. The Nasdaq Composite led the rally, jumping 6.73% to close at 17,382.94, driven by strong performance in the technology sector. The Russell 2000, which tracks small-cap stocks, also advanced, rising 4.09% to finish at 1,957.62. On the economic front, the U.S. Department of Labor reported a slight increase in seasonally adjusted initial unemployment claims. For the week ending April 19, 2025, claims rose by 6,000 to 222,000, up from a revised 216,000 in the prior week. .
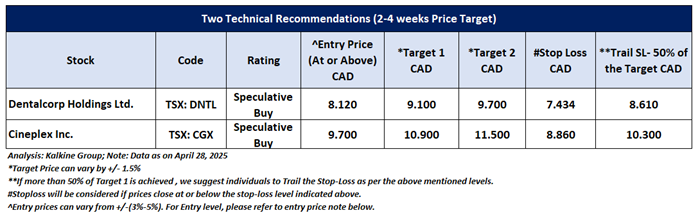
Taking into the US market's performance over the last week, following the major global macros and data front, based on the technical analysis of the S&P/TSX Composite Index, the two TSX listed stocks fit the maximum criteria on the technical framework. The recommendations are based on the generic insights, entry price, target prices, and stop-loss for Dentalcorp Holdings Ltd. (TSX: DNTL) and Cineplex Inc. (TSX: CGX) for the next 2-4 weeks.
Dentalcorp Holdings Ltd. (TSX: DNTL)
Price Action Analysis (on the Daily Chart)
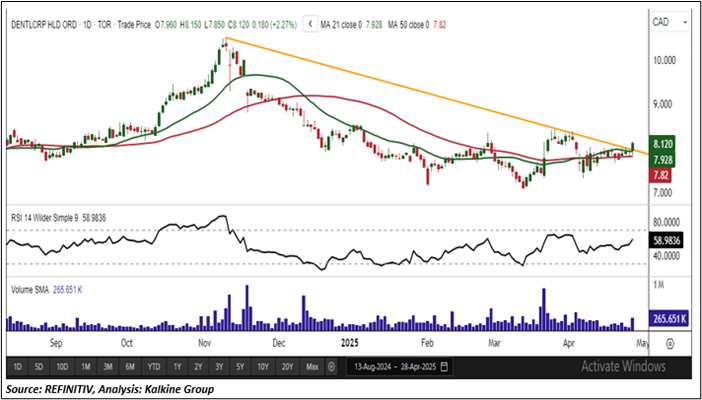
On the daily chart, DNTL is currently holding above a key descending trendline support, signaling the establishment of a stable base. The recent upward price action, supported by increasing trading volumes, reinforces a bullish near-term outlook. Over the next 2 to 4 weeks, the stock appears positioned to challenge the next resistance level at CAD 9.10. A decisive breakout above this level could pave the way for further gains.
Technical Analysis (On the Daily Chart)
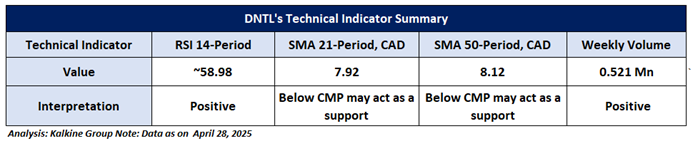
On the daily chart, the 14-period Relative Strength Index (RSI) is hovering around 58.98, indicating positive momentum and suggesting that buyers remain in control. Weekly trading volumes continue to support the recent upward move, highlighting sustained investor interest. Additionally, the stock is trading above its 21-period Simple Moving Average (SMA), which now serves as dynamic support further reinforcing the bullish technical outlook.
General Recommendation:
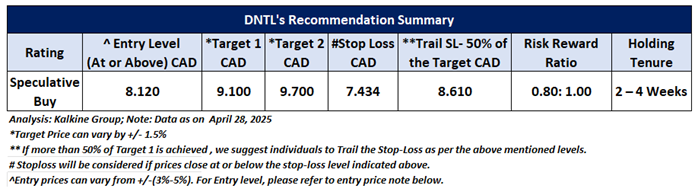
As per the above-mentioned price action and technical analysis, Dentalcorp Holdings Ltd. is looking technically well-placed on the chart, and a ‘Speculative Buy’ recommendation has been given on the stock. Investment decisions should be made depending on an individual’s appetite for upside potential, risks, and any previous holdings.This recommendation is purely based on technical analysis, and fundamental analysis has not been considered in this report. Dentalcorp Holdings Ltd. (TSX: DNTL) was last covered in a report dated '04 June 2024'. Below is the summary of our recommendation.
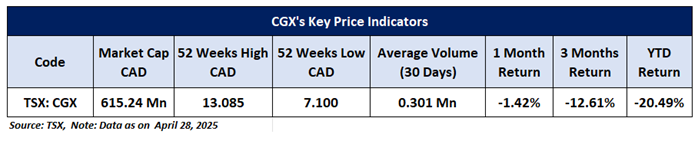
Cineplex Inc. (TSX: CGX)
Price Action Analysis (on the Daily Chart)
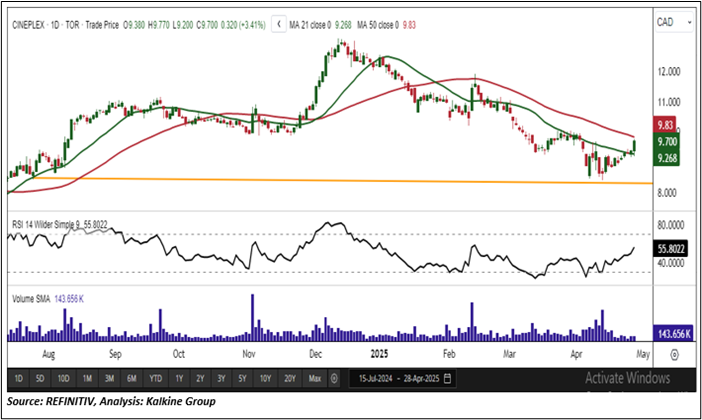
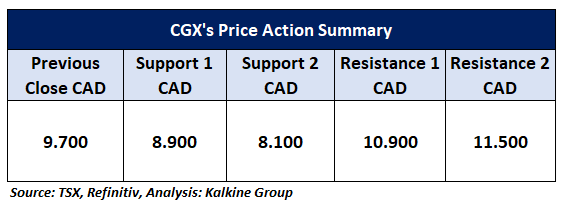
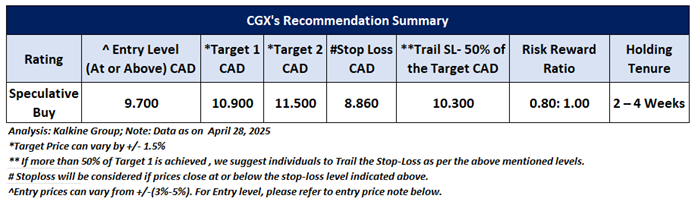
On the daily chart, CGX is trading above a key horizontal trendline support, consistently holding this zone and confirming it as a reliable base. The recent upward price action, supported by increasing trading volumes, adds conviction to the bullish outlook. In the near term (2–4 weeks), the stock may test the next resistance level at CAD 10.90. A breakout above this threshold could unlock further upside potential, while sustained support at current levels would reinforce the stock’s positive momentum and attract continued buying interest.
Technical Indicators Analysis (On the Daily Chart)
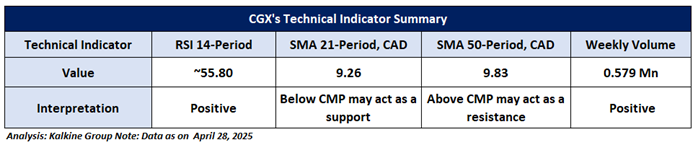
On the daily chart, the 14-period Relative Strength Index (RSI) is currently around 55.80, indicating positive momentum and suggesting that buyers remain in control. The weekly trading volumes continue to support the recent upside, reflecting sustained investor interest. Moreover, the stock is trading above its 21-period Simple Moving Average (SMA), which now acts as a dynamic support level, further reinforcing the bullish technical outlook.
General Recommendation:
As per the above-mentioned price action and technical analysis, Cineplex Inc. looking technically well-placed on the chart, and a ‘Speculative Buy’ recommendation has been given on the stock. Investment decisions should be made depending on an individual’s appetite for upside potential, risks, and any previous holdings.This recommendation is purely based on technical analysis, and fundamental analysis has not been considered in this report. Cineplex Inc. (TSX: CGX) was last covered in a report dated '29 July 2024'. Below is the summary of our recommendation.
Upcoming Major Global Economic Events
Market events occur on a day-to-day basis depending on the frequency of the data and generally include updates on employment, inflation, GDP, consumer sentiments, etc. Noted below are the upcoming week's major global economic events that could impact the S&P/TSX Composite Index and listed stocks' prices.
Related Risks: This report may be looked at from high-risk perspective and recommendations are provided are for a short duration. Recommendations provided in this report are solely based on technical parameters, and the fundamental performance of the stocks has not been considered in the decision-making process. Other factors which could impact the stock prices include market risks, regulatory risks, interest rates risks, currency risks, social and political instability risks etc.
Markets are trading in a highly volatile zone currently due to certain macro-economic issues and geopolitical tensions prevailing. Therefore, it is prudent to follow a cautious approach while investing.
Note 1: Individuals can consider exiting from the stock if the Target Price or Stop loss mentioned as per the technical analysis has been achieved and subject to the factors discussed above.
Note 2: How to Read the Charts?
The Green color line reflects the 21-period moving average, while the Red color line indicates the 50-period moving average. SMA helps to identify existing price trend. If the prices are trading above the 21-period and 50-period moving average, then it shows prices are currently trading in a bullish trend.
The Black color line in the chart's lower segment reflects the Relative Strength Index (14-Period), which indicates price momentum and signals momentum in trend. A reading of 70 or above suggests overbought status, while a reading of 30 or below suggests an oversold status.
The Blue color bars in the chart's lower segment show the volume of the stock. The volume is the number of shares that changed hands during a given day. Stocks with high volumes are more liquid than stocks with lesser volume. Liquidity in stocks helps in easier and faster execution of the order.
The Orange color lines are the trend lines drawn by connecting two or more price points and used for trend identification purposes. The trend line also acts as a line of support and resistance.
Technical Indicators Defined: -
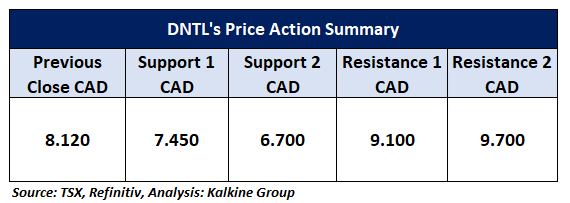
Support: A level at which the stock prices tend to find support if they are falling, and a downtrend may take a pause backed by demand or buying interest. Support 1 refers to the nearby support level for the stock and if the price breaches the level, then Support 2 may act as the crucial support level for the stock.
Resistance: A level at which the stock prices tend to find resistance when they are rising, and an uptrend may take a pause due to profit booking or selling interest. Resistance 1 refers to the nearby resistance level for the stock and if the price surpasses the level, then Resistance 2 may act as the crucial resistance level for the stock.
Stop-loss: It is a level to protect further losses in case of unfavourable movement in the stock prices.
Risk Reward Ratio: The risk reward ratio is the difference between an entry point to a stop loss and profit level. This report is based on ~80% Stop Loss of the Target 1 from the entry point.
A trailing stop-loss is a modification of stop-loss in case of favourable movement in the price to protect the gains. Individuals can Trail the Stop-Loss as per the aforementioned levels if the stock price achieves more than 50% of the Target 1. individuals should consider exiting from the position as per the Trailing Stop-Loss level if the price starts moving downwards after achieving more than 50% of the Target 1.
The reference date for all price data, currency, technical indicators, support, and resistance levels is April 28, 2025. The reference data in this report has been partly sourced from REFINITIV.
Abbreviations
CMP: Current Market Price
SMA: Simple Moving Average
CAD: Canadian Dollar
RSI: Relative Strength Index
Note: Trading decisions require a thorough analysis by individuals. Technical reports in general chart out metrics that may be assessed by individuals before any stock evaluation. The above are illustrative analytical factors used for evaluating the stocks; other parameters can be looked at along with additional risks per se. Past performance is neither an indicator nor a guarantee of future performance.
Past performance is not a reliable indicator of future performance.

 Please wait processing your request...