Company Overview: Integra Resources Corp. (TSXV: ITR) is a Canadian precious metals exploration and development company focusing on gold and silver projects in the Great Basin region of the Western United States. Electrovaya Inc. (TSX: ELVA) is a Canadian-based lithium-ion battery technology and manufacturing company. The company designs, develops, and manufactures proprietary lithium-ion batteries, battery systems, and related products for energy storage, electric transportation, and other specialized applications. This Report covers the Price Action, Technical Indicators Analysis along with the Stop Loss Levels, Target Prices, and Recommendations on these two stocks.
Canada Market Round-Up
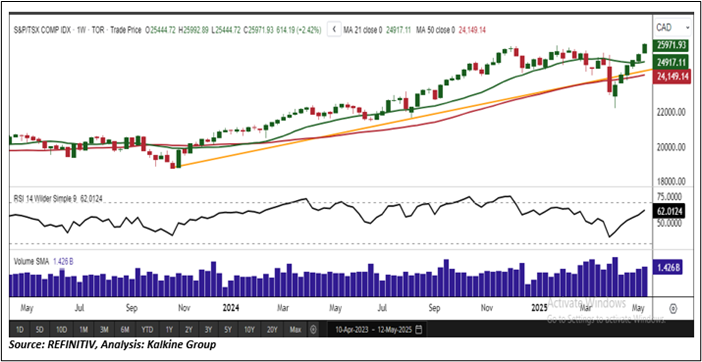
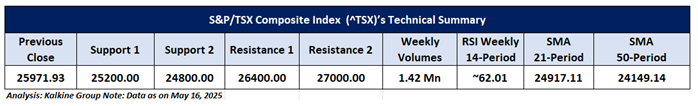
The S&P/TSX Composite Index (TSX: ^TSX) posted a strong performance last week, advancing 614.19 points (+2.42%) to close at 25,971.93. The bullish momentum carried into May 16, with the index climbing an additional 74.45 points (+0.29%), ending the week on a positive note. The rally was broad-based, with notable gains across multiple sectors including healthcare, consumer cyclicals, technology, energy, real estate, utilities, industrials, consumer non-cyclicals, and financials. In contrast, the basic materials sector lagged behind the broader market. On the economic front, Statistics Canada reported that manufacturing sales declined for a second straight month, falling 1.4% in March to $71.9 billion, signalling ongoing challenges in the manufacturing sector. The index remains above its rising trendline and the 50-period Simple Moving Average (SMA), reinforcing the prevailing uptrend. Resistance is noted near 26,400, while support is established around 25,200. The weekly Relative Strength Index (RSI) stands at 62.01, indicating a stable momentum environment with sustained buying interest.
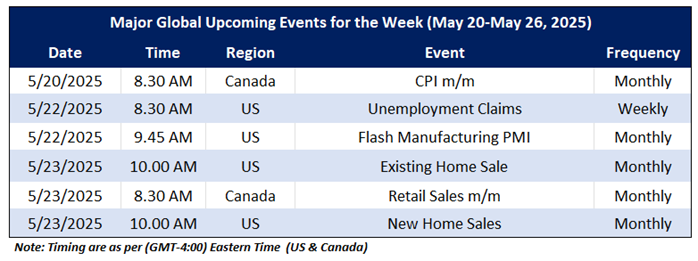
On the macro front, the upcoming major economic events that may impact the Canadian market sentiment include CA CPI m/m, U.S Existing Home Sale and U.S Unemployment Claims.
Global Markets Wrap-Up
U.S. stock markets continued to exhibit strong bullish momentum during the week ending May 16, 2025, with major indices posting solid gains. The Nasdaq Composite advanced 7.15%, closing at 19,211.10, fueled by sustained strength in the technology sector. Meanwhile, the Russell 2000, which represents small-cap stocks, rose 4.46% to finish at 2,113.25, reflecting ongoing resilience among smaller companies. In economic news, the U.S. Department of Labor reported that initial jobless claims for the week ending May 10, 2025, came in at 229,000, unchanged from the previous week. .
Taking into the US market's performance over the last week, following the major global macros and data front, based on the technical analysis of the S&P/TSX Composite Index, the two TSX listed stocks fit the maximum criteria on the technical framework. The recommendations are based on the generic insights, entry price, target prices, and stop-loss for Integra Resources Corp. (TSXV: ITR) and Electrovaya Inc. (TSX: ELVA) for the next 2-4 weeks.
Integra Resources Corp. (TSXV: ITR)
Price Action Analysis (on the Daily Chart)
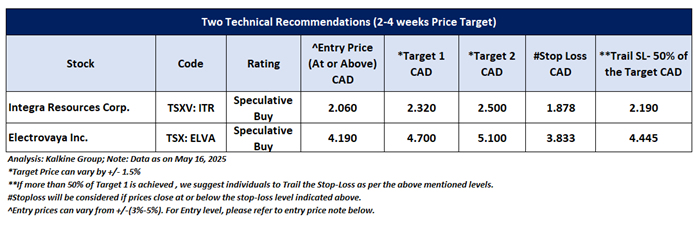
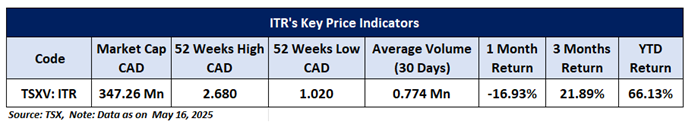
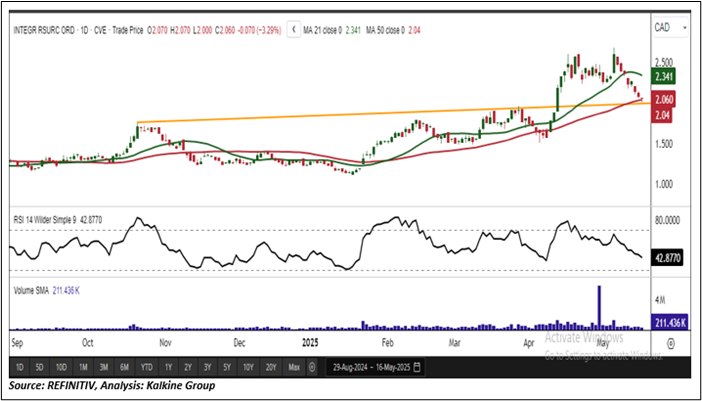
On the daily chart, ITR is maintaining its position above a key rising trendline support, suggesting the formation of a stable technical base. This structural support underscores underlying strength in the current trend. The recent upward price movement, coupled with rising trading volumes, reinforces a bullish near-term outlook and signals increasing market participation. Over the next 2 to 4 weeks, the stock appears well-positioned to challenge the next resistance level at CAD 2.32. A clear breakout above this level could signal the start of a new upward leg, unlocking further momentum-driven gains within the prevailing trend.
Technical Analysis (On the Daily Chart)
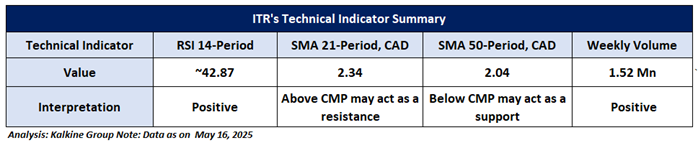
On the daily chart, the 14-period Relative Strength Index (RSI) is currently hovering around 42.87, showing signs of recovery from lower levels an indication of improving momentum. Weekly trading volumes remain supportive of the recent upward price action, highlighting continued investor interest. Furthermore, the stock is now trading above its 50-period Simple Moving Average (SMA), which is acting as dynamic support, reinforcing the bullish technical outlook.
General Recommendation:
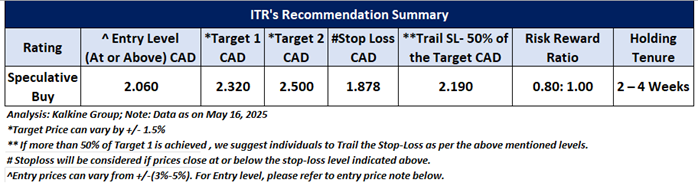
As per the above-mentioned price action and technical analysis, Integra Resources Corp. is looking technically well-placed on the chart, and a ‘Speculative Buy’ recommendation has been given on the stock. Investment decisions should be made depending on an individual’s appetite for upside potential, risks, and any previous holdings.This recommendation is purely based on technical analysis, and fundamental analysis has not been considered in this report. Integra Resources Corp. (TSXV: ITR) was last covered in a report dated '09 April 2024'. Below is the summary of our recommendation.
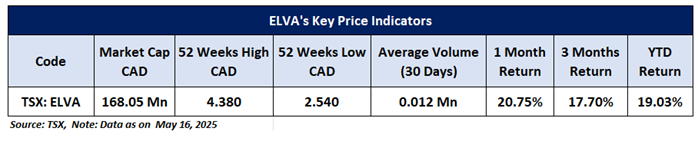
Electrovaya Inc. (TSX: ELVA)
Price Action Analysis (On the Weekly Chart)
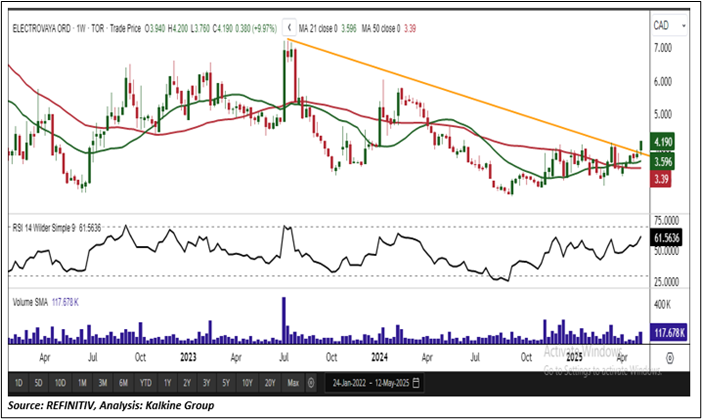
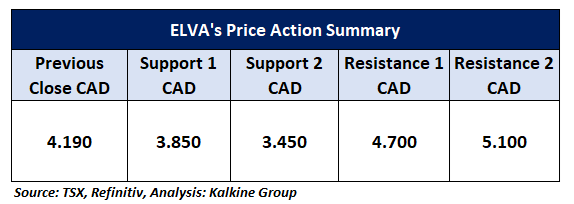
On the weekly chart, ELVA is trading firmly above a key descending trendline, which has now transitioned into a reliable support zone. The stock’s ability to consistently hold this level underscores growing technical strength. The recent upward price movement, supported by increasing trading volumes, reflects rising investor confidence and reinforces the bullish outlook. Looking ahead to the near term (2–4 weeks), ELVA appears well-positioned to test the next key resistance level at CAD 4.70. A decisive breakout above this threshold could open the door to further upside potential. Conversely, continued support near current levels would confirm positive momentum and is likely to attract sustained buying interest.
Technical Indicators Analysis (On the Weekly Chart)
On the weekly chart, the 14-period Relative Strength Index (RSI) is currently at approximately 61.56, reflecting positive momentum and indicating that buyers remain in control of the trend. Weekly trading volumes continue to align with the recent upside, reinforcing sustained investor interest and supporting the strength of the move. Moreover, the stock is trading above its 21-period Simple Moving Average (SMA), which now acts as dynamic support, adding further credibility to the bullish technical setup.

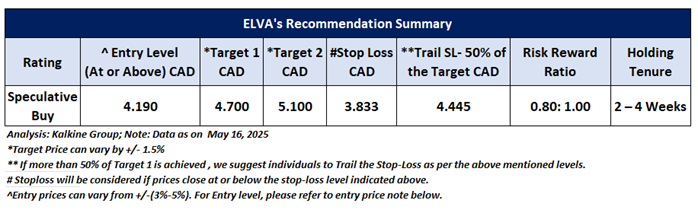
General Recommendation:
As per the above-mentioned price action and technical analysis, Electrovaya Inc. looking technically well-placed on the chart, and a ‘Speculative Buy’ recommendation has been given on the stock. Investment decisions should be made depending on an individual’s appetite for upside potential, risks, and any previous holdings.This recommendation is purely based on technical analysis, and fundamental analysis has not been considered in this report. Electrovaya Inc. (TSX: ELVA) was last covered in a report dated '11 July 2023'. Below is the summary of our recommendation.
Upcoming Major Global Economic Events
Market events occur on a day-to-day basis depending on the frequency of the data and generally include updates on employment, inflation, GDP, consumer sentiments, etc. Noted below are the upcoming week's major global economic events that could impact the S&P/TSX Composite Index and listed stocks' prices.
Related Risks: This report may be looked at from high-risk perspective and recommendations are provided are for a short duration. Recommendations provided in this report are solely based on technical parameters, and the fundamental performance of the stocks has not been considered in the decision-making process. Other factors which could impact the stock prices include market risks, regulatory risks, interest rates risks, currency risks, social and political instability risks etc.
Markets are trading in a highly volatile zone currently due to certain macro-economic issues and geopolitical tensions prevailing. Therefore, it is prudent to follow a cautious approach while investing.
Note 1: Individuals can consider exiting from the stock if the Target Price or Stop loss mentioned as per the technical analysis has been achieved and subject to the factors discussed above.
Note 2: How to Read the Charts?
The Green color line reflects the 21-period moving average, while the Red color line indicates the 50-period moving average. SMA helps to identify existing price trend. If the prices are trading above the 21-period and 50-period moving average, then it shows prices are currently trading in a bullish trend.
The Black color line in the chart's lower segment reflects the Relative Strength Index (14-Period), which indicates price momentum and signals momentum in trend. A reading of 70 or above suggests overbought status, while a reading of 30 or below suggests an oversold status.
The Blue color bars in the chart's lower segment show the volume of the stock. The volume is the number of shares that changed hands during a given day. Stocks with high volumes are more liquid than stocks with lesser volume. Liquidity in stocks helps in easier and faster execution of the order.
The Orange color lines are the trend lines drawn by connecting two or more price points and used for trend identification purposes. The trend line also acts as a line of support and resistance.
Technical Indicators Defined: -
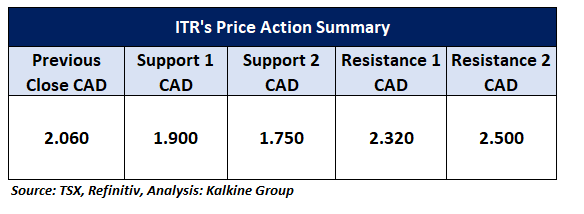
Support: A level at which the stock prices tend to find support if they are falling, and a downtrend may take a pause backed by demand or buying interest. Support 1 refers to the nearby support level for the stock and if the price breaches the level, then Support 2 may act as the crucial support level for the stock.
Resistance: A level at which the stock prices tend to find resistance when they are rising, and an uptrend may take a pause due to profit booking or selling interest. Resistance 1 refers to the nearby resistance level for the stock and if the price surpasses the level, then Resistance 2 may act as the crucial resistance level for the stock.
Stop-loss: It is a level to protect further losses in case of unfavourable movement in the stock prices.
Risk Reward Ratio: The risk reward ratio is the difference between an entry point to a stop loss and profit level. This report is based on ~80% Stop Loss of the Target 1 from the entry point.
A trailing stop-loss is a modification of stop-loss in case of favourable movement in the price to protect the gains. Individuals can Trail the Stop-Loss as per the aforementioned levels if the stock price achieves more than 50% of the Target 1. individuals should consider exiting from the position as per the Trailing Stop-Loss level if the price starts moving downwards after achieving more than 50% of the Target 1.
The reference date for all price data, currency, technical indicators, support, and resistance levels is May 16, 2025. The reference data in this report has been partly sourced from REFINITIV.
Abbreviations
CMP: Current Market Price
SMA: Simple Moving Average
CAD: Canadian Dollar
RSI: Relative Strength Index
Note: Trading decisions require a thorough analysis by individuals. Technical reports in general chart out metrics that may be assessed by individuals before any stock evaluation. The above are illustrative analytical factors used for evaluating the stocks; other parameters can be looked at along with additional risks per se. Past performance is neither an indicator nor a guarantee of future performance.
Past performance is not a reliable indicator of future performance.

 Please wait processing your request...