Company Overview: Canadian Utilities Ltd. (TSX: CU), a subsidiary of Atco, provides essential energy services across multiple sectors. The company engages in power generation, transmission, and distribution. Stella-Jones Inc. (TSX: SJ) is a leading manufacturer and supplier of lumber and wood products, serving various industries. The company includes utility poles, railway ties, residential lumber, and industrial wood products designed for durability and long-term use. This Report covers the Price Action, Technical Indicators Analysis along with the Stop Loss Levels, Target Prices, and Recommendations on these two stocks.
Canada Market Round-Up
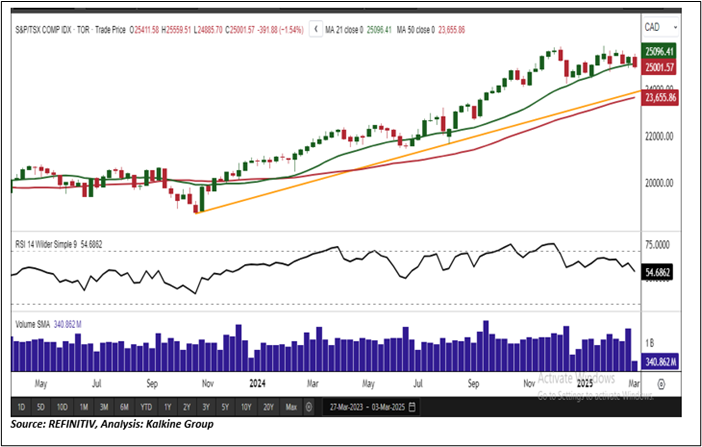
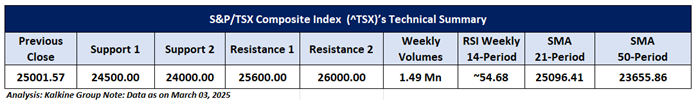
The S&P/TSX Composite Index (TSX: ^TSX) started the previous week with strong bullish momentum, gaining 246.42 points (0.98%) to close at 25,393.45 on February 28, 2025. However, on March 3, 2025, the index saw a notable pullback, dropping 391.80 points (1.54%) to close at 25,001.57. Sector performance was mixed, with Utilities and real estate leading gains, while consumer non-cyclicals, energy, financials, technology, industrials, consumer cyclicals, basic materials, and healthcare underperformed. Meanwhile, Statistics Canada reported a 0.6% increase in real GDP for Q4 2024, indicating steady economic expansion. From a technical standpoint, the index remains above rising trendline support and the 50-period SMA, suggesting that the broader uptrend is intact despite short-term volatility. Key resistance is near 25,600, while support sits around 24,500. The weekly RSI at 54.68 reflects solid momentum, implying that buyers are still active in the market.
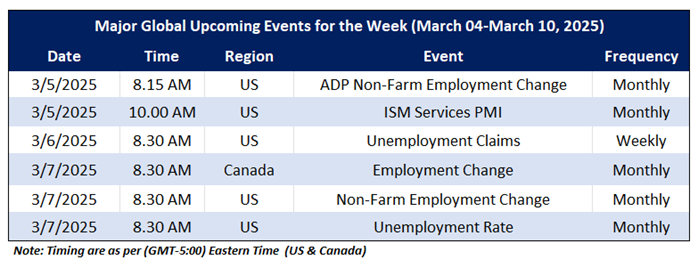
On the macro front, the upcoming major economic events that may impact the Canadian market sentiment include CA Employment Change, U.S Non-Farm Employment Change and U.S Unemployment Claims.
Global Markets Wrap-Up
For the week ending February 28, 2025, U.S. equities faced downward pressure, with major indices posting losses. The Nasdaq Composite closed at 18,847.28, marking a 3.47% decline, while the Russell 2000 dropped 1.47% to 2,163.07. Labor market data indicated a rise in unemployment claims, as reported by the U.S. Department of Labor. Seasonally adjusted initial jobless claims increased by 22,000 to 242,000 for the week ending February 22, 2025, compared to 220,000 in the prior week. .
Taking into the US market's performance over the last week, following the major global macros and data front, based on the technical analysis of the S&P/TSX Composite Index, the two TSX listed stocks fit the maximum criteria on the technical framework. The recommendations are based on the generic insights, entry price, target prices, and stop-loss for Canadian Utilities Ltd. (TSX: CU) and Stella-Jones Inc. (TSX: SJ) for the next 2-4 weeks.
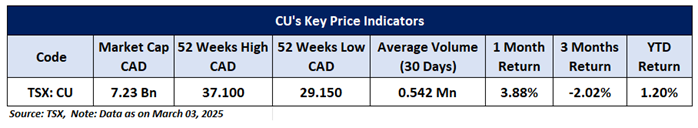
Canadian Utilities Ltd. (TSX: CU)
Price Action Analysis (on the Daily Chart)
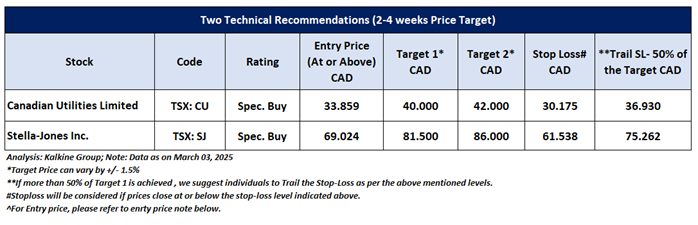
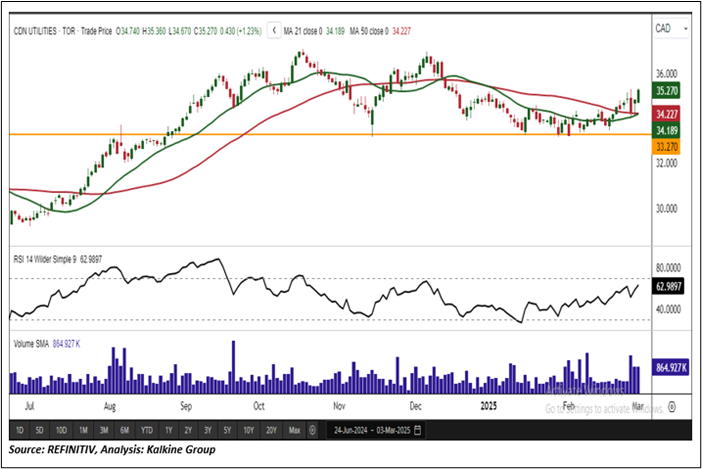
On the daily chart, CU stock is holding above a key horizontal trendline support, confirming a stable base. The recent upward movement, backed by increasing trading volumes, strengthens the bullish outlook for the stock. In the short term (2-4 weeks), the stock may test the next resistance level at CAD 40.00. A breakout above this level could signal further upside potential, while maintaining support at current levels would reinforce positive momentum.
Technical Analysis (On the Daily Chart)
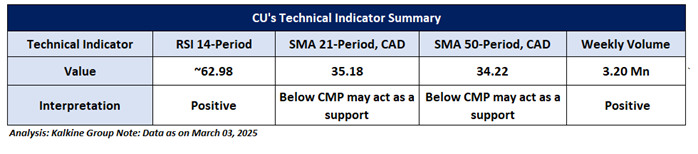
On the daily chart, the momentum oscillator RSI (14-period) sits at approximately 62.98, indicating positive momentum. The weekly trading volumes further support the ongoing uptrend, suggesting strong buying interest. Additionally, the stock is trading above the 21-period Simple Moving Average (SMA), which could act as a dynamic support level, reinforcing the bullish outlook.
General Recommendation:
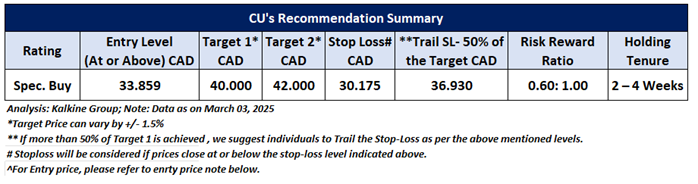
As per the above-mentioned price action and technical analysis, Canadian Utilities Ltd. is looking technically well-placed on the chart, and a ‘Speculative Buy’ recommendation has been given on the stock. Investment decisions should be made depending on an individual’s appetite for upside potential, risks, and any previous holdings.This recommendation is purely based on technical analysis, and fundamental analysis has not been considered in this report. Canadian Utilities Ltd. (TSX: CU) was last covered in a report dated '03 April 2023'. Below is the summary of our recommendation.
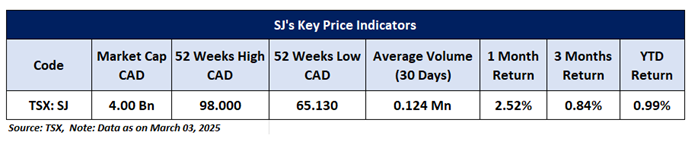
Stella-Jones Inc. (TSX: SJ)
Price Action Analysis (on the Daily Chart)
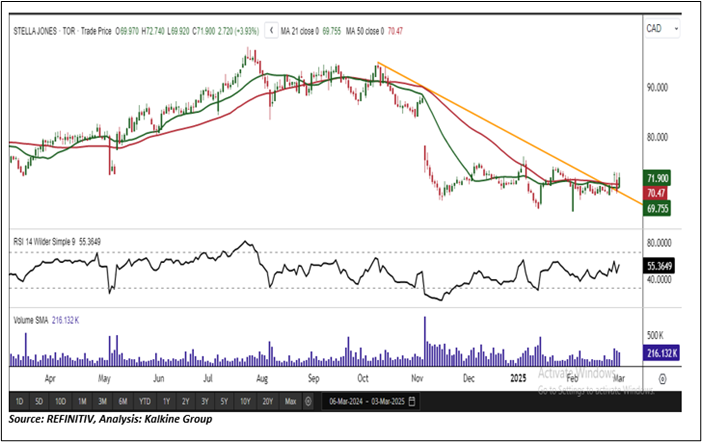
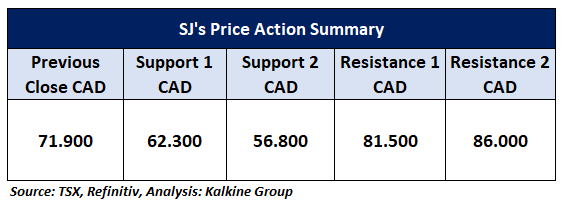
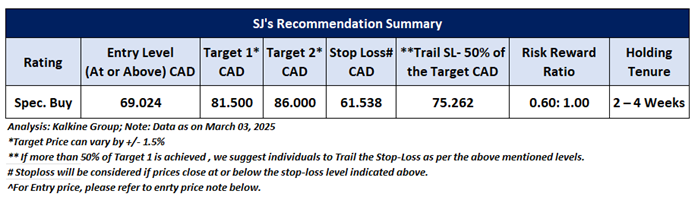
On the daily chart, SJ stock is trading above a falling trendline support, consistently holding this zone as a key support level. The recent upward movement, backed by increasing trading volumes, reinforces a bullish outlook for the stock. In the short term (2-4 weeks), the stock may test the next resistance level at CAD 81.50. A breakout above this level could signal further upside potential, while continued support at current levels would strengthen the positive momentum.
Technical Indicators Analysis (On the Daily Chart)
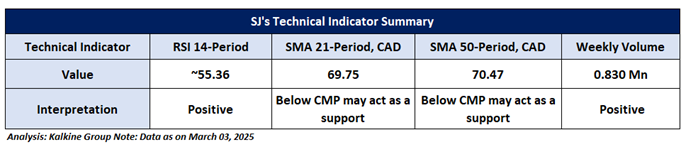
On the daily chart, the momentum oscillator RSI (14-period) is at approximately 55.36, indicating positive momentum. The weekly trading volumes support the recent upside movement, suggesting continued buying interest. Additionally, the stock is trading above the 21-period Simple Moving Average (SMA), which may serve as a support level, further strengthening the bullish outlook.
General Recommendation:
As per the above-mentioned price action and technical analysis, Stella-Jones Inc. looking technically well-placed on the chart, and a ‘Speculative Buy’ recommendation has been given on the stock. Investment decisions should be made depending on an individual’s appetite for upside potential, risks, and any previous holdings.This recommendation is purely based on technical analysis, and fundamental analysis has not been considered in this report. Stella-Jones Inc. (TSX: SJ) was last covered in a report dated '15 September 2023'. Below is the summary of our recommendation.
Upcoming Major Global Economic Events
Market events occur on a day-to-day basis depending on the frequency of the data and generally include updates on employment, inflation, GDP, consumer sentiments, etc. Noted below are the upcoming week's major global economic events that could impact the S&P/TSX Composite Index and listed stocks' prices.
Related Risks: This report may be looked at from high-risk perspective and recommendations are provided are for a short duration. Recommendations provided in this report are solely based on technical parameters, and the fundamental performance of the stocks has not been considered in the decision-making process. Other factors which could impact the stock prices include market risks, regulatory risks, interest rates risks, currency risks, social and political instability risks etc.
Markets are trading in a highly volatile zone currently due to certain macro-economic issues and geopolitical tensions prevailing. Therefore, it is prudent to follow a cautious approach while investing.
Note 1: Individuals can consider exiting from the stock if the Target Price or Stop loss mentioned as per the technical analysis has been achieved and subject to the factors discussed above.
Note 2: How to Read the Charts?
The Green color line reflects the 21-period moving average, while the Red color line indicates the 50-period moving average. SMA helps to identify existing price trend. If the prices are trading above the 21-period and 50-period moving average, then it shows prices are currently trading in a bullish trend.
The Black color line in the chart's lower segment reflects the Relative Strength Index (14-Period), which indicates price momentum and signals momentum in trend. A reading of 70 or above suggests overbought status, while a reading of 30 or below suggests an oversold status.
The Blue color bars in the chart's lower segment show the volume of the stock. The volume is the number of shares that changed hands during a given day. Stocks with high volumes are more liquid than stocks with lesser volume. Liquidity in stocks helps in easier and faster execution of the order.
The Orange color lines are the trend lines drawn by connecting two or more price points and used for trend identification purposes. The trend line also acts as a line of support and resistance.
Technical Indicators Defined: -
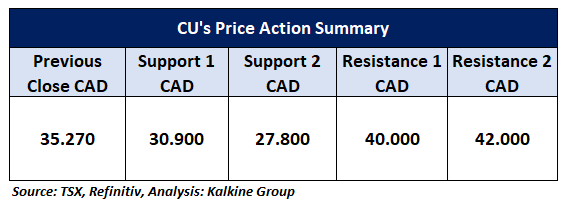
Support: A level at which the stock prices tend to find support if they are falling, and a downtrend may take a pause backed by demand or buying interest. Support 1 refers to the nearby support level for the stock and if the price breaches the level, then Support 2 may act as the crucial support level for the stock.
Resistance: A level at which the stock prices tend to find resistance when they are rising, and an uptrend may take a pause due to profit booking or selling interest. Resistance 1 refers to the nearby resistance level for the stock and if the price surpasses the level, then Resistance 2 may act as the crucial resistance level for the stock.
Stop-loss: It is a level to protect further losses in case of unfavourable movement in the stock prices.
Risk Reward Ratio: The risk reward ratio is the difference between an entry point to a stop loss and profit level. This report is based on ~60% Stop Loss of the Target 1 from the entry point.
A trailing stop-loss is a modification of stop-loss in case of favourable movement in the price to protect the gains. Individuals can Trail the Stop-Loss as per the aforementioned levels if the stock price achieves more than 50% of the Target 1. individuals should consider exiting from the position as per the Trailing Stop-Loss level if the price starts moving downwards after achieving more than 50% of the Target 1.
The reference date for all price data, currency, technical indicators, support, and resistance levels is March 03, 2025. The reference data in this report has been partly sourced from REFINITIV.
Abbreviations
CMP: Current Market Price
SMA: Simple Moving Average
CAD: Canadian Dollar
RSI: Relative Strength Index
Note: Trading decisions require a thorough analysis by individuals. Technical reports in general chart out metrics that may be assessed by individuals before any stock evaluation. The above are illustrative analytical factors used for evaluating the stocks; other parameters can be looked at along with additional risks per se. Past performance is neither an indicator nor a guarantee of future performance.
Past performance is not a reliable indicator of future performance.

 Please wait processing your request...