Company Overview: Ivanhoe Mines Ltd. (TSX: IVN) is a mineral exploration and development company engaged in the exploration, development, and recovery of minerals and precious gems. Through its subsidiaries, the company operates various mining projects across Africa. Baytex Energy Corp. (TSX: BTE) is a prominent oil and gas company with operations spanning both Canada and the United States. However, the company generates the majority of its revenue from its Canadian segment, which focuses on the exploration, development, and production of crude oil and natural gas, primarily in Western Canada. This Report covers the Price Action, Technical Indicators Analysis along with the Stop Loss Levels, Target Prices, and Recommendations on these two stocks.
Canada Market Round-Up
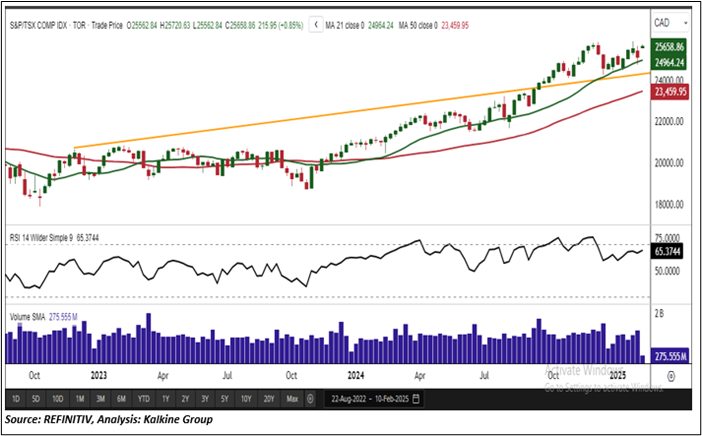
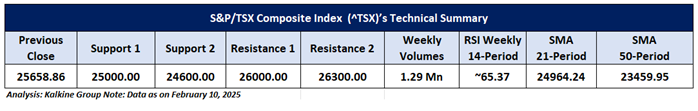
The benchmark S&P/TSX Composite Index (TSX: ^TSX) started last week on a negative note and maintained a negative momentum for the entire week. The S&P/TSX composite index declined by 90.19 points (0.35%) to 25442.91 for the week ending February 07, 2025. However, on February 10, 2025, the index rebounded, closing at 25,658.86, an increase of 215.95 points or approximately 0.85%. Among the top-performing sectors on Monday were Basic Materials, technology, consumer non-cyclicals, energy, real estate, industrials, consumer cyclicals, and utilities, while healthcare and financials lagged. According to data from Statistics Canada, Canada’s unemployment rate dropped by 0.1 percentage points to 6.6% in January. From a technical perspective, the weekly chart shows that the index is trading above a rising trendline support zone. Additionally, prices are holding above the 21-period and 50-period SMAs, which could act as support levels. The immediate resistance level is around 26,000, while support lies near 25,000. On the weekly timeframe, the RSI is currently at approximately 65.37, indicating strong momentum.
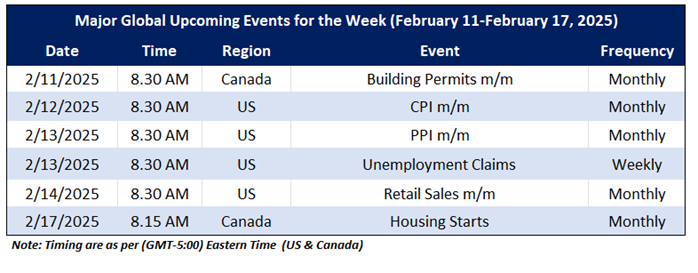
On the macro front, the upcoming major economic events that may impact the Canadian market sentiment include CA Building Permits m/m, U.S CPI m/m and U.S Unemployment Claims.
Global Markets Wrap-Up
For the week ending February 7, 2025, the Nasdaq Composite closed at 19,523.40, reflecting a decline of approximately 0.53%. Similarly, the Russell 2000 dropped by around 0.35%, closing at 2,279.71. According to the weekly data published by the U.S. Department of Labor, the seasonally adjusted initial US jobless claims incresed by 11,000 to 219,000 for the week ending February 01, 2025, against the initial claims at 208,000 in the prior week.
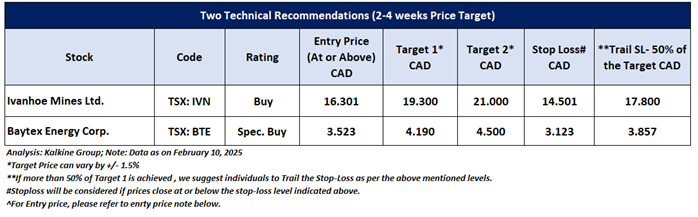
Taking into the US market's performance over the last week, following the major global macros and data front, based on the technical analysis of the S&P/TSX Composite Index, the two TSX listed stocks fit the maximum criteria on the technical framework. The recommendations are based on the generic insights, entry price, target prices, and stop-loss for Ivanhoe Mines Ltd. (TSX: IVN) and Baytex Energy Corp. (TSX: BTE) for the next 2-4 weeks.
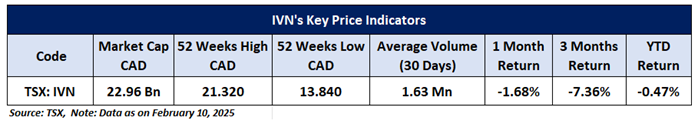
Ivanhoe Mines Ltd. (TSX: IVN)
Price Action Analysis (on the Daily Chart)
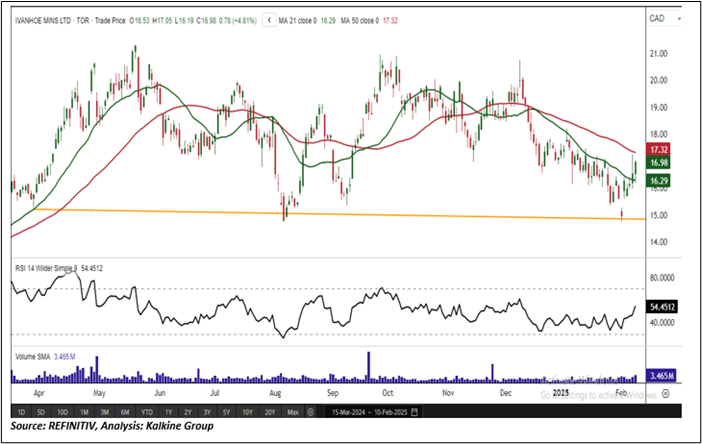
On the daily chart, IVN stock is holding above the horizontal trendline support level and finding support at this zone. The recent upward movement is accompanied by rising volumes, reinforcing a positive bias for the stock.The next resistance level is plotted around CAD 19.30, and the stock may test that level in the short term (2-4 weeks).
Technical Analysis (On the Daily Chart)
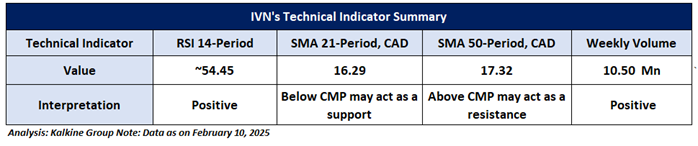
On the daily chart, the momentum oscillator RSI (14-period) stands at ~54.45, signaling positive momentum. Weekly volumes also support the ongoing upward movement. Furthermore, the stock is trading above the 21-period SMA, which could act as a support level, reinforcing the bullish outlook.
General Recommendation:
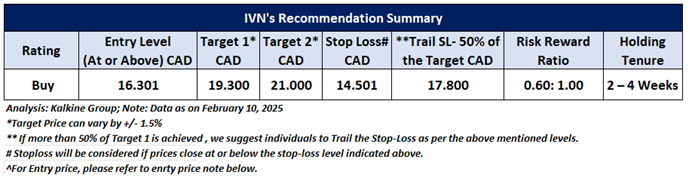
As per the above-mentioned price action and technical analysis, Ivanhoe Mines Ltd. is looking technically well-placed on the chart, and a ‘Buy’ recommendation has been given on the stock. Investment decisions should be made depending on an individual’s appetite for upside potential, risks, and any previous holdings.This recommendation is purely based on technical analysis, and fundamental analysis has not been considered in this report. Ivanhoe Mines Ltd. (TSX: IVN) was last covered in a report dated '17 April 2024'. Below is the summary of our recommendation.
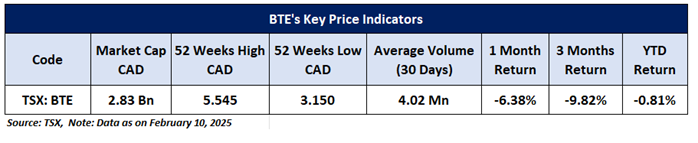
Baytex Energy Corp. (TSX: BTE)
Price Action Analysis (on the Daily Chart)
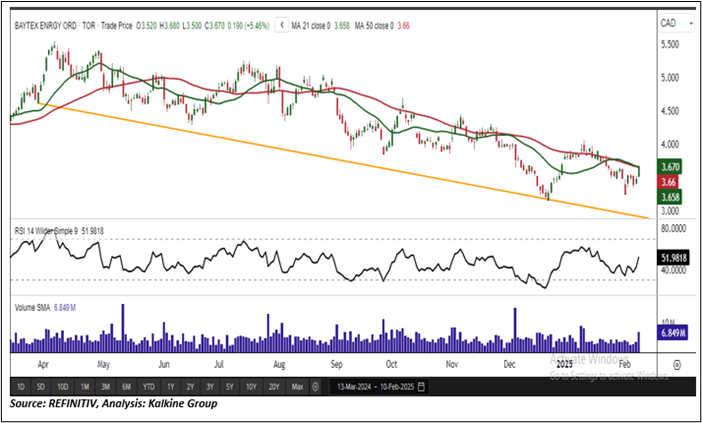
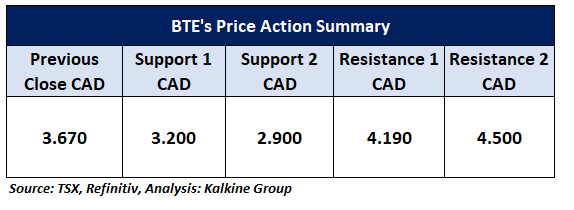
On the daily chart, BTE stock is trading above the downward-sloping trendline support level and consistently finding support at this zone. The recent upward movement is accompanied by rising volumes, reinforcing a positive bias for the stock. The next resistance level is placed around CAD 4.19, and the stock may test that level in the short term (2-4 weeks).
Technical Indicators Analysis (On the Daily Chart)
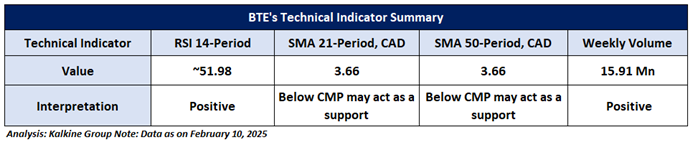
On the daily chart, the momentum oscillator RSI (14-period) is currently at ~51.98, indicating positive momentum. Additionally, the weekly volumes appear to support the recent upside movement. The stock is also trading above the 21-period SMA, which may act as a support level, further reinforcing the bullish outlook.

General Recommendation:
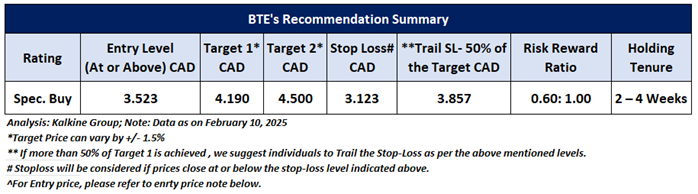
As per the above-mentioned price action and technical analysis, Baytex Energy Corp. looking technically well-placed on the chart, and a ‘Speculative Buy’ recommendation has been given on the stock. Investment decisions should be made depending on an individual’s appetite for upside potential, risks, and any previous holdings.This recommendation is purely based on technical analysis, and fundamental analysis has not been considered in this report. Baytex Energy Corp. (TSX: BTE) was last covered in a report dated '16 December 2024'. Below is the summary of our recommendation.
Upcoming Major Global Economic Events
Market events occur on a day-to-day basis depending on the frequency of the data and generally include updates on employment, inflation, GDP, consumer sentiments, etc. Noted below are the upcoming week's major global economic events that could impact the S&P/TSX Composite Index and listed stocks' prices.
Related Risks: This report may be looked at from high-risk perspective and recommendations are provided are for a short duration. Recommendations provided in this report are solely based on technical parameters, and the fundamental performance of the stocks has not been considered in the decision-making process. Other factors which could impact the stock prices include market risks, regulatory risks, interest rates risks, currency risks, social and political instability risks etc.
Markets are trading in a highly volatile zone currently due to certain macro-economic issues and geopolitical tensions prevailing. Therefore, it is prudent to follow a cautious approach while investing.
Note 1: Individuals can consider exiting from the stock if the Target Price or Stop loss mentioned as per the technical analysis has been achieved and subject to the factors discussed above.
Note 2: How to Read the Charts?
The Green color line reflects the 21-period moving average, while the Red color line indicates the 50-period moving average. SMA helps to identify existing price trend. If the prices are trading above the 21-period and 50-period moving average, then it shows prices are currently trading in a bullish trend.
The Black color line in the chart's lower segment reflects the Relative Strength Index (14-Period), which indicates price momentum and signals momentum in trend. A reading of 70 or above suggests overbought status, while a reading of 30 or below suggests an oversold status.
The Blue color bars in the chart's lower segment show the volume of the stock. The volume is the number of shares that changed hands during a given day. Stocks with high volumes are more liquid than stocks with lesser volume. Liquidity in stocks helps in easier and faster execution of the order.
The Orange color lines are the trend lines drawn by connecting two or more price points and used for trend identification purposes. The trend line also acts as a line of support and resistance.
Technical Indicators Defined: -
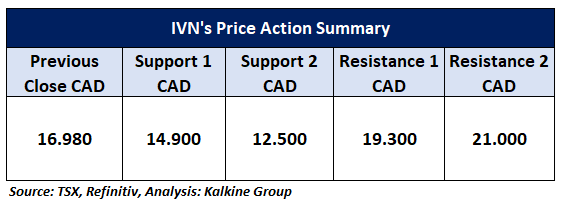
Support: A level at which the stock prices tend to find support if they are falling, and a downtrend may take a pause backed by demand or buying interest. Support 1 refers to the nearby support level for the stock and if the price breaches the level, then Support 2 may act as the crucial support level for the stock.
Resistance: A level at which the stock prices tend to find resistance when they are rising, and an uptrend may take a pause due to profit booking or selling interest. Resistance 1 refers to the nearby resistance level for the stock and if the price surpasses the level, then Resistance 2 may act as the crucial resistance level for the stock.
Stop-loss: It is a level to protect further losses in case of unfavourable movement in the stock prices.
Risk Reward Ratio: The risk reward ratio is the difference between an entry point to a stop loss and profit level. This report is based on ~60% Stop Loss of the Target 1 from the entry point.
A trailing stop-loss is a modification of stop-loss in case of favourable movement in the price to protect the gains. Individuals can Trail the Stop-Loss as per the aforementioned levels if the stock price achieves more than 50% of the Target 1. individuals should consider exiting from the position as per the Trailing Stop-Loss level if the price starts moving downwards after achieving more than 50% of the Target 1.
The reference date for all price data, currency, technical indicators, support, and resistance levels is February 10, 2025. The reference data in this report has been partly sourced from REFINITIV.
Abbreviations
CMP: Current Market Price
SMA: Simple Moving Average
CAD: Canadian Dollar
RSI: Relative Strength Index
Note: Trading decisions require a thorough analysis by individuals. Technical reports in general chart out metrics that may be assessed by individuals before any stock evaluation. The above are illustrative analytical factors used for evaluating the stocks; other parameters can be looked at along with additional risks per se. Past performance is neither an indicator nor a guarantee of future performance.
Past performance is not a reliable indicator of future performance.

 Please wait processing your request...