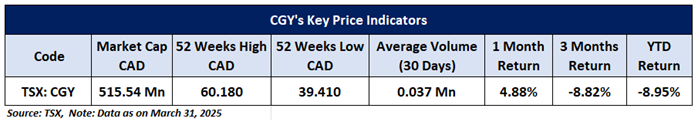
Company Overview: Calian Group Ltd. (TSX: CGY) operates across four key segments: Advanced Technologies, Health, Learning, and Information Technology. The health segment contributes the largest share of the company’s revenue. Calian serves a diverse range of industries, including healthcare, defense, security, aerospace, engineering, agricultural technology (AgTech), and IT, leveraging its expertise to deliver innovative solutions across these sectors. This Report covers the Price Action, Technical Indicators Analysis along with the Stop Loss Levels, Target Prices, and Recommendation on this one stock.
Canada Market Round-Up
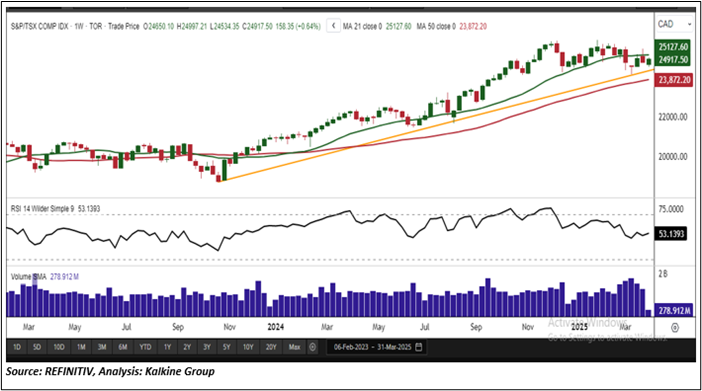
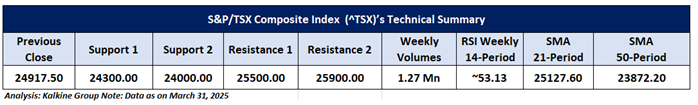
The S&P/TSX Composite Index (TSX: ^TSX) experienced a downward trend throughout the past week, closing on March 28, 2025, with a decline of 209.34 points (0.84%) at 24,759.15. However, the index rebounded on March 31, 2025, gaining 158.35 points (0.64%) to close at 24,917.50. The market recovery was driven by strength in multiple sectors, including consumer non-cyclicals, healthcare, energy, real estate, industrials, consumer cyclicals, basic materials, utilities, and financials, while technology remained the only underperformer. Meanwhile, Statistics Canada reported a 0.4% growth in real gross domestic product (GDP) for January, adding to the positive market sentiment. From a technical perspective, the index remains above a key rising trendline support zone and continues to trade above the 50-period simple moving average (SMA), reinforcing its position as a critical support level. The immediate resistance is near 25,500, while crucial support is around 24,300. Additionally, the Relative Strength Index (RSI) on the weekly timeframe stands at approximately 53.13, indicating strong momentum despite recent fluctuations.
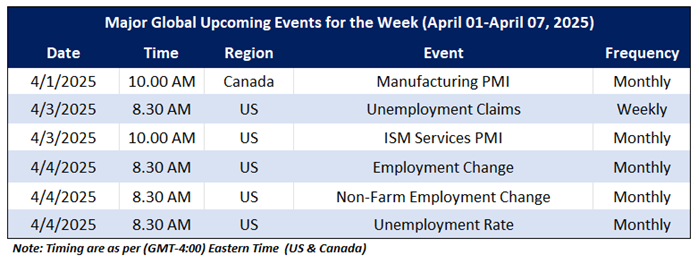
On the macro front, the upcoming major economic events that may impact the Canadian market sentiment include CA Manufacturing PMI, US Non-Farm Employment Change and US Unemployment Claims.
Global Markets Wrap-Up
For the week ending March 28, 2025, the Nasdaq Composite declined by approximately 2.59%, closing at 17,322.99. The Russell 2000 also saw a drop of around 1.64%, finishing at 2,023.27, reflecting broader weakness in small-cap stocks.
Meanwhile, the U.S. labor market showed resilience, as seasonally adjusted initial unemployment insurance claims fell by 1,000 to 224,000 for the week ending March 22, 2025. This marks a slight decrease from the revised 225,000 claims reported the previous week, according to the U.S. Department of Labor.
Taking into the US market's performance over the last week, following the major global macros and data front, based on the technical analysis of the S&P/TSX Composite Index, the one TSX listed stock fit the maximum criteria on the technical framework. The recommendations are based on the generic insights, entry price, target prices, and stop-loss for Calian Group Ltd. (TSX: CGY) for the next 2-4 weeks.
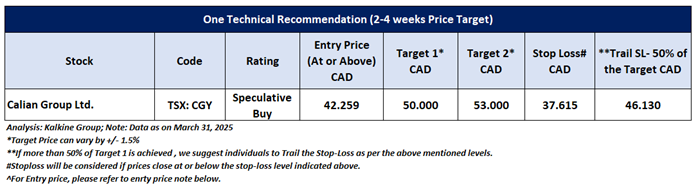
Calian Group Ltd. (TSX: CGY)
Price Action Analysis (On the Daily Chart)
On the daily chart, CGY stock continues to maintain its position above the falling trendline support, consistently attracting buying interest at this critical level. The recent upward movement, coupled with rising trading volumes, reinforces bullish sentiment and signals strong market participation. In the short term (2-4 weeks), if momentum persists, the stock could challenge the next resistance level near CAD 50.00. A sustained breakout above this level would further strengthen the bullish outlook, while a drop below the trendline support may indicate a potential shift in sentiment.
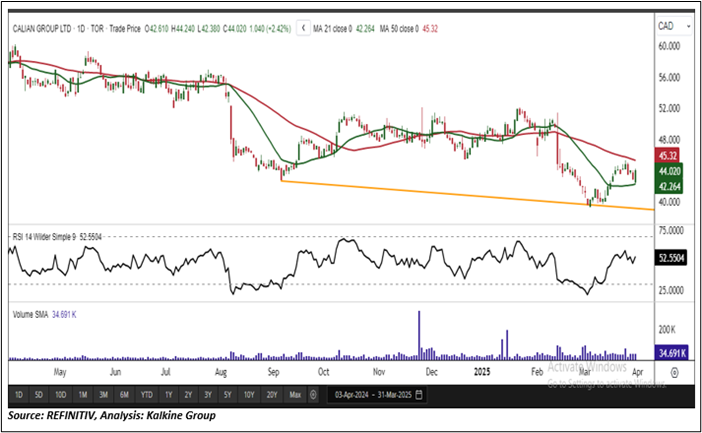
Technical Analysis (On the Daily Chart)
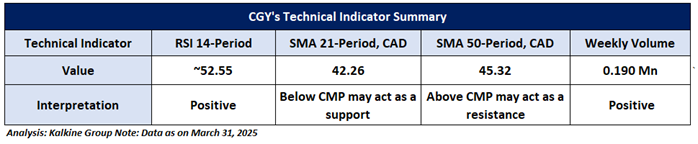
On the daily chart, the 14-period Relative Strength Index (RSI) stands at approximately 52.55, rebounding from lower levels and signalling a potential shift in momentum. Weekly trading volumes remain supportive of the ongoing price movement, reflecting sustained demand. Additionally, the stock is trading above the 21-period Simple Moving Average (SMA), reinforcing its role as a key support level and further strengthening the bullish outlook.
General Recommendation:
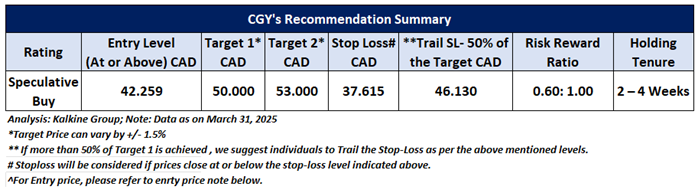
As per the above-mentioned price action and technical analysis, Calian Group Ltd. is looking technically well-placed on the chart, and a ‘Speculative Buy’ recommendation has been given on the stock. Investment decisions should be made depending on an individual’s appetite for upside potential, risks, and any previous holdings. This recommendation is purely based on technical analysis, and fundamental analysis has not been considered in this report. Below is the summary of our recommendation.
Upcoming Major Global Economic Events
Market events occur on a day-to-day basis depending on the frequency of the data and generally include updates on employment, inflation, GDP, consumer sentiments, etc. Noted below are the upcoming week's major global economic events that could impact the S&P/TSX Composite Index and listed stocks' prices.
Related Risks: This report may be looked at from high-risk perspective and recommendations are provided are for a short duration. Recommendations provided in this report are solely based on technical parameters, and the fundamental performance of the stocks has not been considered in the decision-making process. Other factors which could impact the stock prices include market risks, regulatory risks, interest rates risks, currency risks, social and political instability risks etc.
Note 1: Individuals can consider exiting from the stock if the Target Price or Stop loss mentioned as per the technical analysis has been achieved and subject to the factors discussed above.
Note 2: How to Read the Charts?
The Green color line reflects the 21-period moving average, while the Red color line indicates the 50-period moving average. SMA helps to identify existing price trend. If the prices are trading above the 21-period and 50-period moving average, then it shows prices are currently trading in a bullish trend.
The Black color line in the chart's lower segment reflects the Relative Strength Index (14-Period), which indicates price momentum and signals momentum in trend. A reading of 70 or above suggests overbought status, while a reading of 30 or below suggests an oversold status.
The Blue color bars in the chart's lower segment show the volume of the stock. The volume is the number of shares that changed hands during a given day. Stocks with high volumes are more liquid than stocks with lesser volume. Liquidity in stocks helps in easier and faster execution of the order.
The Orange color lines are the trend lines drawn by connecting two or more price points and used for trend identification purposes. The trend line also acts as a line of support and resistance.
Technical Indicators Defined: -
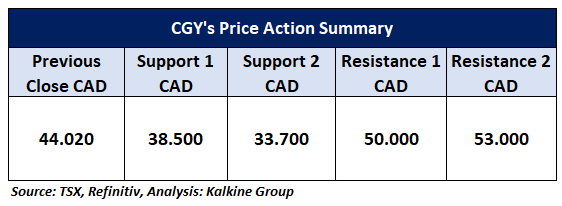
Support: A level at which the stock prices tend to find support if they are falling, and a downtrend may take a pause backed by demand or buying interest. Support 1 refers to the nearby support level for the stock and if the price breaches the level, then Support 2 may act as the crucial support level for the stock.
Resistance: A level at which the stock prices tend to find resistance when they are rising, and an uptrend may take a pause due to profit booking or selling interest. Resistance 1 refers to the nearby resistance level for the stock and if the price surpasses the level, then Resistance 2 may act as the crucial resistance level for the stock.
Stop-loss: It is a level to protect further losses in case of unfavorable movement in the stock prices.
Risk Reward Ratio: The risk reward ratio is the difference between an entry point to a stop loss and profit level. This report is based on ~60% Stop Loss of the Target 1 from the entry point.
A trailing stop-loss is a modification of stop-loss in case of favourable movement in the price to protect the gains. Individuals can Trail the Stop-Loss as per the aforementioned levels if the stock price achieves more than 50% of the Target 1. individuals should consider exiting from the position as per the Trailing Stop-Loss level if the price starts moving downwards after achieving more than 50% of the Target 1.
The reference date for all price data, currency, technical indicators, support, and resistance levels is March 31, 2025. The reference data in this report has been partly sourced from REFINITIV.
Abbreviations
CMP: Current Market Price
SMA: Simple Moving Average
CAD: Canadian Dollar
RSI: Relative Strength Index
Note: Trading decisions require a thorough analysis by individuals. Technical reports in general chart out metrics that may be assessed by individuals before any stock evaluation. The above are illustrative analytical factors used for evaluating the stocks; other parameters can be looked at along with additional risks per se. Past performance is neither an Indicator nor a guarantee of future performance.
Past performance is not a reliable indicator of future performance.

 Please wait processing your request...