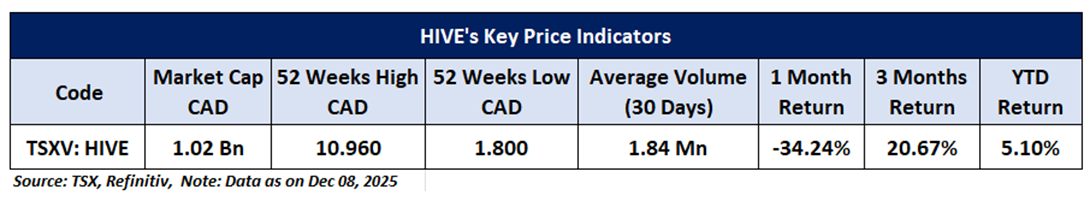
Company Overview: HIVE Blockchain Technologies Ltd. (TSXV: HIVE) operates within the blockchain infrastructure sector, with a primary focus on the mining of digital currencies. The company develops and manages high-performance data center facilities that support cryptocurrency mining and related blockchain applications. This Report covers Price Action, Technical Indicators Analysis along with the Stop Loss Levels, Target Prices, and Recommendation on this one stock.
Canada Market Round-Up
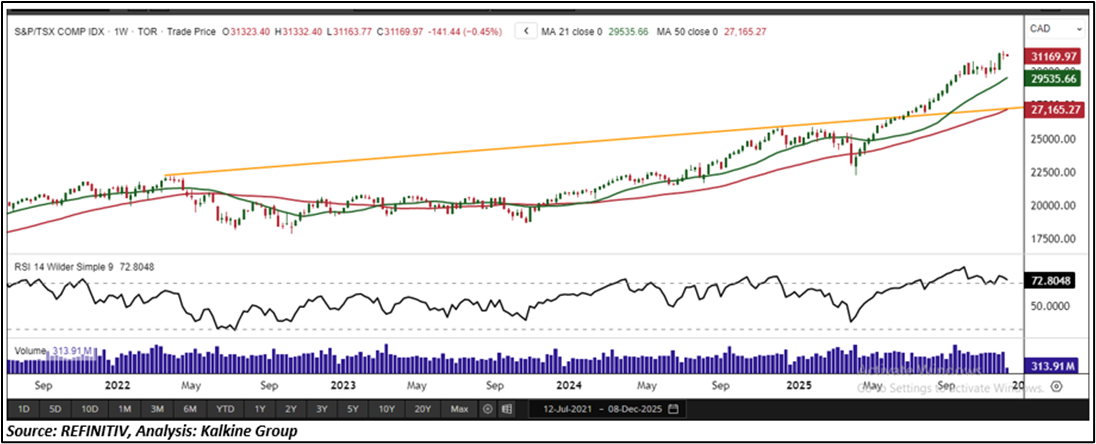
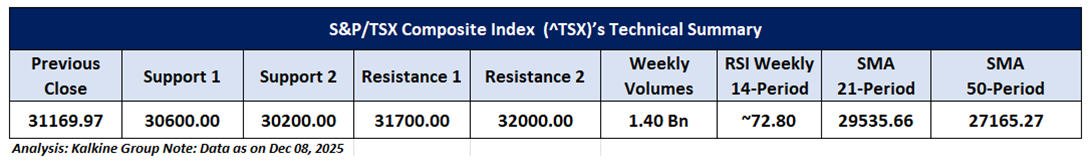
The S&P/TSX Composite Index ended last week on a softer note, slipping 0.23% to close at 31,311.41. On December 08, the benchmark extended its near-term negative momentum, declining a further 141.44 points (0.45%) amid broad-based weakness. Strength was observed primarily in the financial sector, while energy, industrials, healthcare, real estate, basic materials, consumer cyclicals, consumer non-cyclicals, utilities, and technology underperformed, collectively limiting any meaningful upside. From a technical standpoint, the index continues to maintain a firm bullish structure. Price action remains comfortably above both the rising trendline support and the 21-period Simple Moving Average (SMA), reinforcing the prevailing uptrend and indicating ongoing demand on pullbacks. Immediate resistance is positioned near the 31,700 level, and a decisive breakout above this area could unlock further upside momentum. On the downside, initial support rests around 30,600; a sustained move below this threshold may trigger a short-term corrective pullback. The weekly Relative Strength Index (RSI) currently reads 72.80, reflecting strong and persistent buying momentum. While supportive of a constructive medium-term outlook, this elevated reading also places the index in overbought territory, increasing the likelihood of near-term consolidation or profit-taking before the next potential advance.
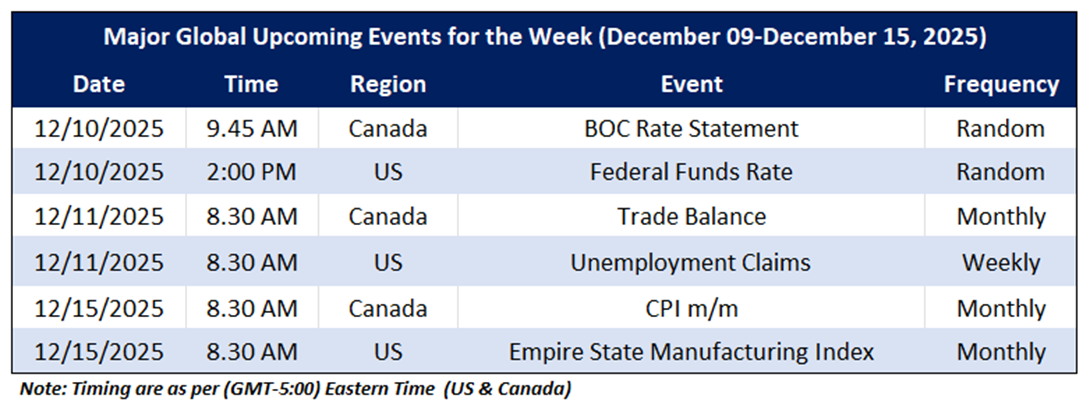
On the macro front, the upcoming major economic events that may impact the Canadian market sentiment include CA BOC Rate Statement, US Federal Funds Rate and US Unemployment Claims.
Global Markets Wrap-Up
U.S. equity markets posted solid gains for the week ending December 05, 2025, with major benchmarks finishing broadly higher. The Nasdaq Composite led the advance, climbing 0.91% to close at 23,578.13, underscoring renewed investor appetite for growth-oriented stocks. The Russell 2000 also performed well, rising 0.84% to 2,521.48 and signaling continued strength within the small-cap segment despite the broader market’s upward move. On the macroeconomic front, labor market conditions showed improvement. The U.S. Department of Labor reported that seasonally adjusted initial jobless claims fell by 27,000 to 191,000 for the week ending November 29, 2025, down from a revised 218,000 in the prior week.
Taking into the US market's performance over the last week, following the major global macros and data front, based on the technical analysis of the S&P/TSX Composite Index, the one TSX listed stock fit the maximum criteria on the technical framework. The recommendations are based on the generic insights, entry price, target prices, and stop-loss for HIVE Blockchain Technologies Ltd. (TSXV: HIVE) for the next 2-4 weeks.
HIVE Blockchain Technologies Ltd. (TSXV: HIVE)
Price Action Analysis (On the Daily Chart)
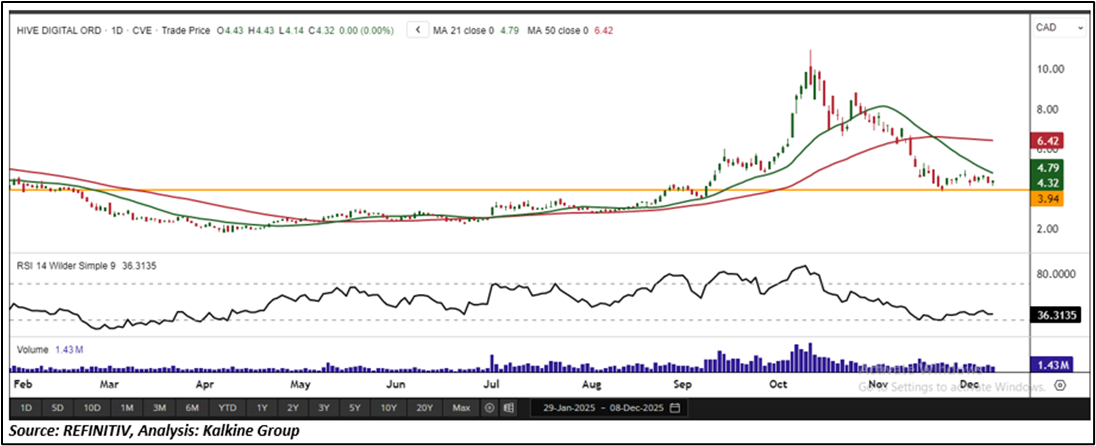
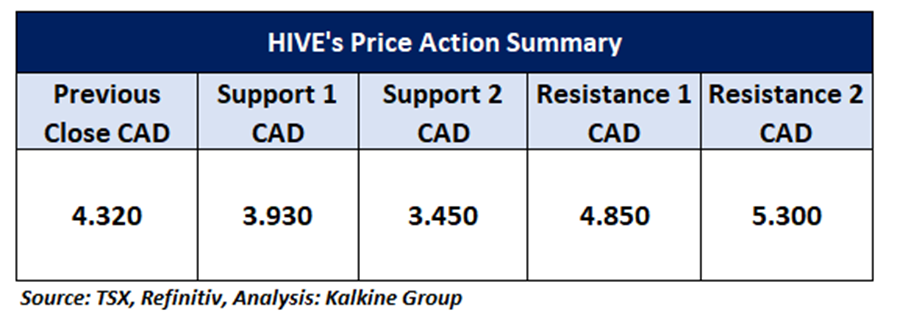
On the daily chart, HIVE continues to trade above a horizontal trendline support, underscoring sustained buying interest at current levels. The recent rebound, accompanied by a noticeable uptick in trading volumes, highlights strengthening bullish momentum and increasing investor participation. If this positive sentiment persists over the next 2–4 weeks, the stock appears well-positioned to retest immediate resistance near CAD 4.85. A decisive breakout above CAD 5.30 would confirm a continuation of the broader uptrend, potentially opening the door to additional upside in the near term.
Technical Analysis (On the Daily Chart)
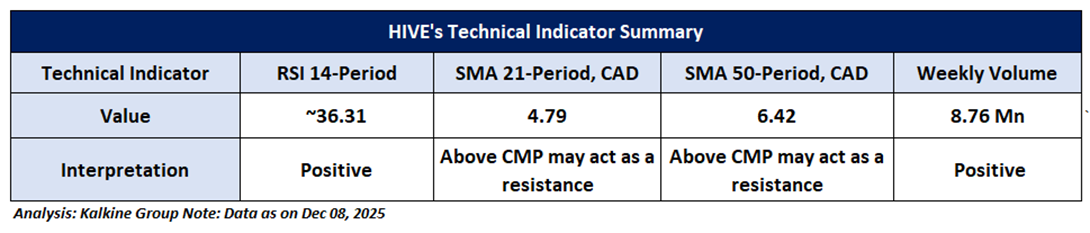
On the daily chart, the 14-period Relative Strength Index (RSI) stands at 36.31, indicating that momentum remains subdued but showing early signs of stabilization. This level suggests the stock has room to recover should buying interest continue to build. Weekly trading volumes have remained consistently firm, reinforcing this view by highlighting steady investor participation and healthy market activity. However, the stock continues to trade below its 21-period Simple Moving Average (SMA), which is acting as dynamic resistance.
General Recommendation:
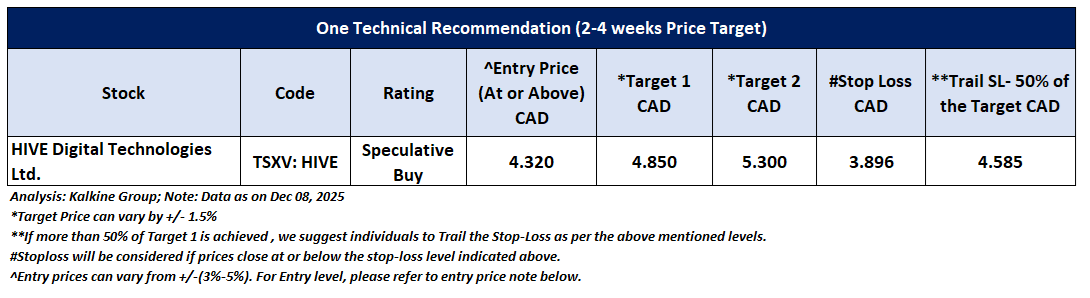
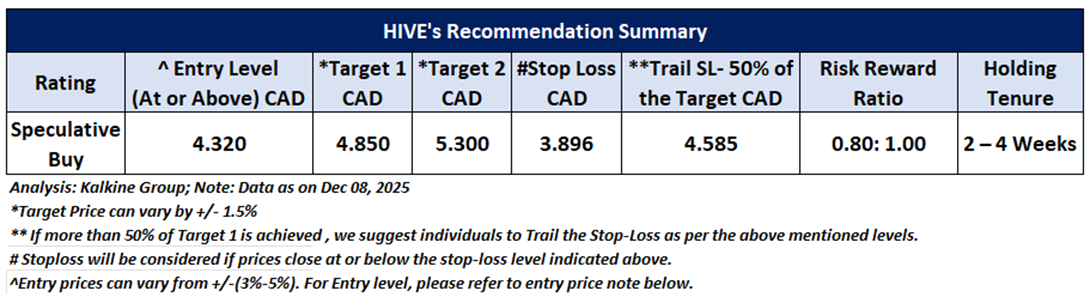
As per the above-mentioned price action and technical analysis, HIVE Blockchain Technologies Ltd. is looking technically well-placed on the chart, and a ‘Speculative Buy’ recommendation has been given on the stock. Investment decisions should be made depending on an individual’s appetite for upside potential, risks, and any previous holdings. This recommendation is purely based on technical analysis, and fundamental analysis has not been considered in this report. Below is the summary of our recommendation.
Upcoming Major Global Economic Events
Market events occur on a day-to-day basis depending on the frequency of the data and generally include updates on employment, inflation, GDP, consumer sentiments, etc. Noted below are the upcoming week's major global economic events that could impact the S&P/TSX Composite Index and listed stocks' prices.
Related Risks: This report may be looked at from high-risk perspective and recommendations are provided are for a short duration. Recommendations provided in this report are solely based on technical parameters, and the fundamental performance of the stocks has not been considered in the decision-making process. Other factors which could impact the stock prices include market risks, regulatory risks, interest rates risks, currency risks, social and political instability risks etc.
Note 1: Individuals can consider exiting from the stock if the Target Price or Stop loss mentioned as per the technical analysis has been achieved and subject to the factors discussed above.
Note 2: How to Read the Charts?
The Green color line reflects the 21-period moving average, while the Red color line indicates the 50-period moving average. SMA helps to identify existing price trend. If the prices are trading above the 21-period and 50-period moving average, then it shows prices are currently trading in a bullish trend.
The Black color line in the chart's lower segment reflects the Relative Strength Index (14-Period), which indicates price momentum and signals momentum in trend. A reading of 70 or above suggests overbought status, while a reading of 30 or below suggests an oversold status.
The Blue color bars in the chart's lower segment show the volume of the stock. The volume is the number of shares that changed hands during a given day. Stocks with high volumes are more liquid than stocks with lesser volume. Liquidity in stocks helps in easier and faster execution of the order.
The Orange color lines are the trend lines drawn by connecting two or more price points and used for trend identification purposes. The trend line also acts as a line of support and resistance.
Technical Indicators Defined: -
Support: A level at which the stock prices tend to find support if they are falling, and a downtrend may take a pause backed by demand or buying interest. Support 1 refers to the nearby support level for the stock and if the price breaches the level, then Support 2 may act as the crucial support level for the stock.
Resistance: A level at which the stock prices tend to find resistance when they are rising, and an uptrend may take a pause due to profit booking or selling interest. Resistance 1 refers to the nearby resistance level for the stock and if the price surpasses the level, then Resistance 2 may act as the crucial resistance level for the stock.
Stop-loss: It is a level to protect further losses in case of unfavorable movement in the stock prices.
Risk Reward Ratio: The risk reward ratio is the difference between an entry point to a stop loss and profit level. This report is based on ~80% Stop Loss of the Target 1 from the entry point.
A trailing stop-loss is a modification of stop-loss in case of favourable movement in the price to protect the gains. Individuals can Trail the Stop-Loss as per the aforementioned levels if the stock price achieves more than 50% of the Target 1. individuals should consider exiting from the position as per the Trailing Stop-Loss level if the price starts moving downwards after achieving more than 50% of the Target 1.
The reference date for all price data, currency, technical indicators, support, and resistance levels is December 08, 2025. The reference data in this report has been partly sourced from REFINITIV.
Abbreviations
CMP: Current Market Price
SMA: Simple Moving Average
CAD: Canadian Dollar
RSI: Relative Strength Index
Note: Trading decisions require a thorough analysis by individuals. Technical reports in general chart out metrics that may be assessed by individuals before any stock evaluation. The above are illustrative analytical factors used for evaluating the stocks; other parameters can be looked at along with additional risks per se. Past performance is neither an Indicator nor a guarantee of future performance.
Past performance is not a reliable indicator of future performance.

 Please wait processing your request...