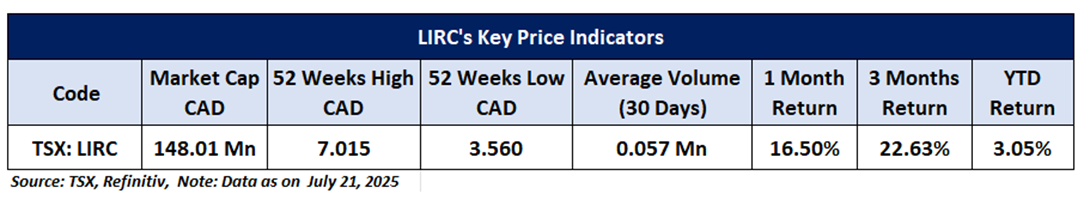
Company Overview: Lithium Royalty Corp. (TSX: LIRC) is a Canada-based, lithium-focused royalty company. It holds a globally diversified portfolio of approximately 35 revenue-generating royalties on mineral properties worldwide. These assets supply and are expected to continue supplying raw materials critical to the electrification of transportation and the broader decarbonization of the global economy. This Report covers Price Action, Technical Indicators Analysis along with the Stop Loss Levels, Target Prices, and Recommendation on this one stock.
Canada Market Round-Up
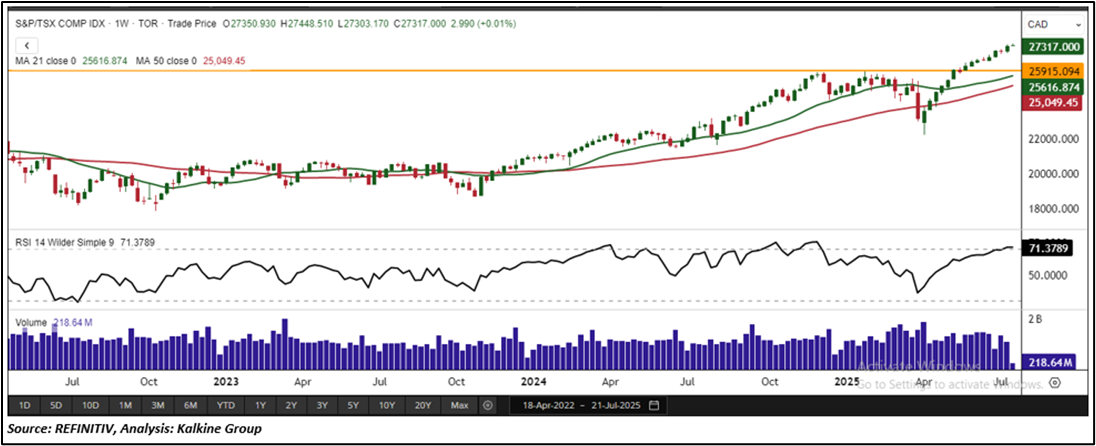
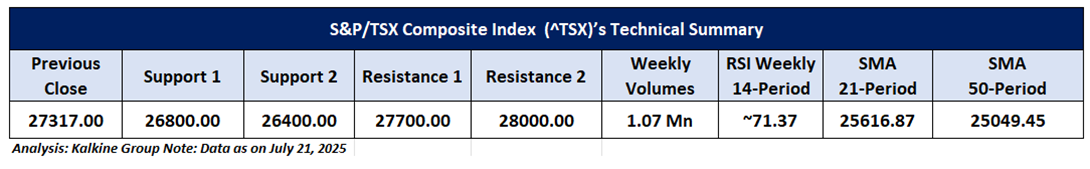
The S&P/TSX Composite Index (TSX: ^TSX) delivered a positive performance last week, rising 1.08% to close at 27,314.01 amid broad-based gains. The index also began the new week on a firm footing, edging up by 2.99 points (+0.01%) on July 21. The rally was supported by strength in several sectors, including basic materials, technology, utilities, and real estate, while industrials, energy, financials, consumer non-cyclicals, consumer cyclicals, and healthcare underperformed the broader market. On the economic front, Statistics Canada reported that the Industrial Product Price Index rose 0.4% month over month in June, marking a 1.7% increase year over year highlighting moderate inflationary trends within the industrial sector. From a technical perspective, the index remains positioned above its horizontal trendline and the 21-period Simple Moving Average (SMA), reinforcing its ongoing bullish bias. Immediate resistance is seen near the 27,700 level, while key support is identified around 26,800. The weekly Relative Strength Index (RSI) stands at 71.37, indicating steady momentum but also suggesting that the market is approaching overbought territory a sign that traders should watch for possible near-term consolidation or a modest pullback.
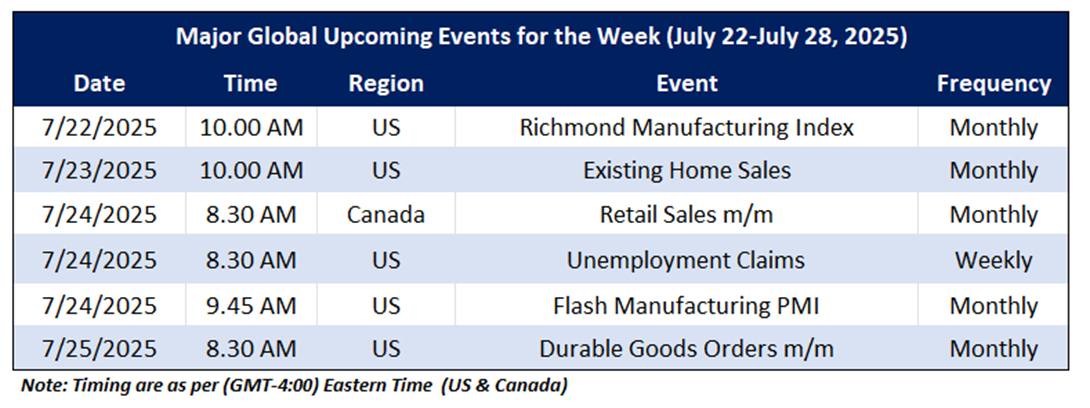
On the macro front, the upcoming major economic events that may impact the Canadian market sentiment include CA Retail Sales m/m, US Existing Home Sales and US Unemployment Claims.
Global Markets Wrap-Up
U.S. equity markets extended their bullish momentum for the week ending July 18, 2025, with major indices posting gains across the board. The Nasdaq Composite led the advance, rising 1.51% to close at 20,895.65, driven by continued strength in the technology sector. Russell 2000, a key benchmark for small-cap stocks, also delivered a positive performance, adding 0.23%, to finish at 2,240.00. On the economic front, the U.S. Department of Labor reported a modest improvement in initial jobless claims. For the week ending July 12, 2025, seasonally adjusted claims declined by 7,000 to 221,000, down from a revised 228,000 the previous week highlighting continued resilience in the labor market.
Taking into the US market's performance over the last week, following the major global macros and data front, based on the technical analysis of the S&P/TSX Composite Index, the one TSX listed stock fit the maximum criteria on the technical framework. The recommendations are based on the generic insights, entry price, target prices, and stop-loss for Lithium Royalty Corp. (TSX: LIRC) for the next 2-4 weeks.
Lithium Royalty Corp. (TSX: LIRC)
Price Action Analysis (On the Daily Chart)
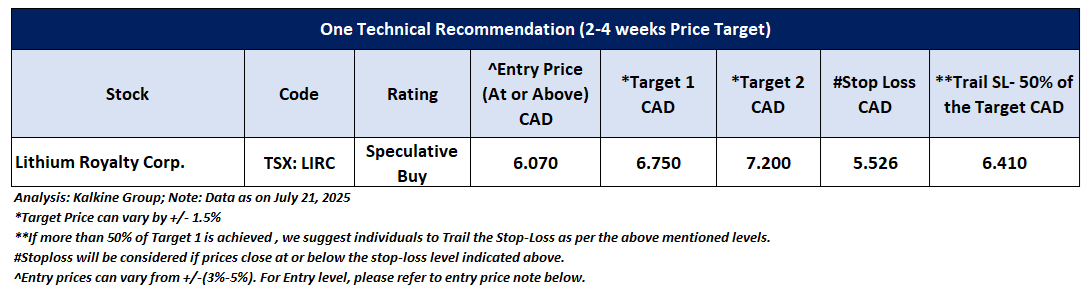
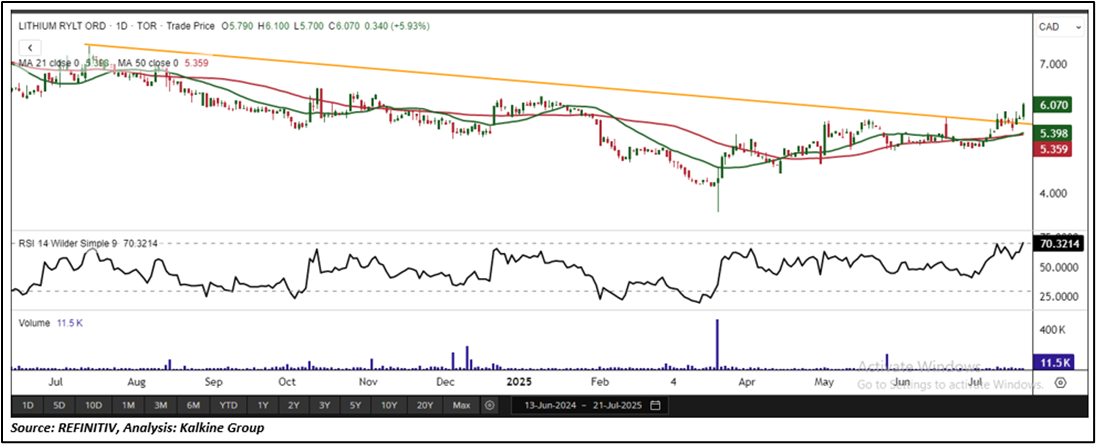
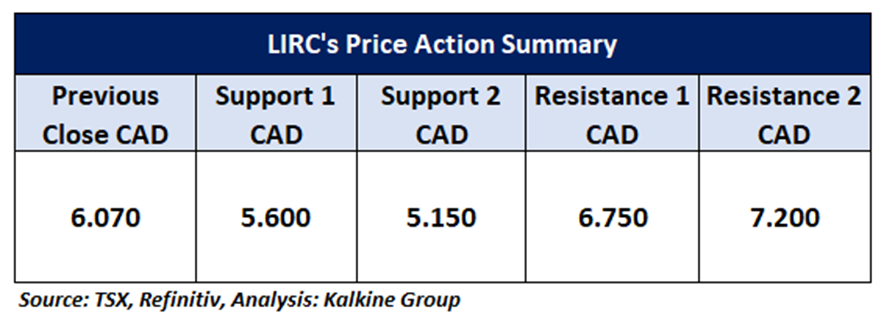
On the daily chart, LIRC continues to trade above a key falling trendline breakout, highlighting sustained buying interest at current levels. The stock’s recent upward movement, supported by rising trading volumes, indicates strengthening bullish momentum and growing market participation. If this positive sentiment persists over the next 2 to 4 weeks, LIRC appears well-positioned to test resistance around CAD 6.75. A decisive breakout above CAD 7.20 would likely confirm the continuation of the uptrend, potentially opening the door for further gains.
Technical Analysis (On the Daily Chart)
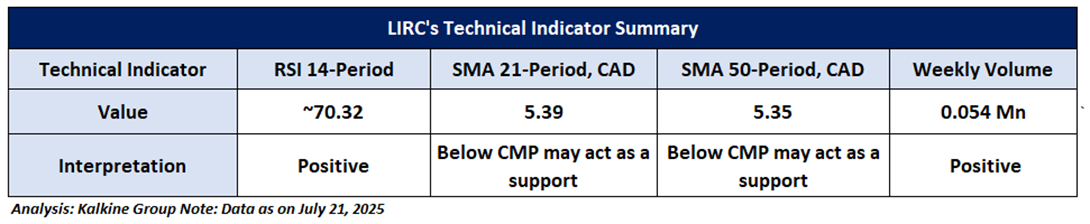
On the daily chart, the 14-period Relative Strength Index (RSI) is hovering near 70.32, indicating solid momentum and a potential shift towards further upside. Weekly trading volumes remain robust, reinforcing the prevailing price trend and highlighting steady market participation. Additionally, the stock continues to trade comfortably above its 21-period Simple Moving Average (SMA), which serves as a dynamic support level, further underpinning the bullish outlook.
General Recommendation:
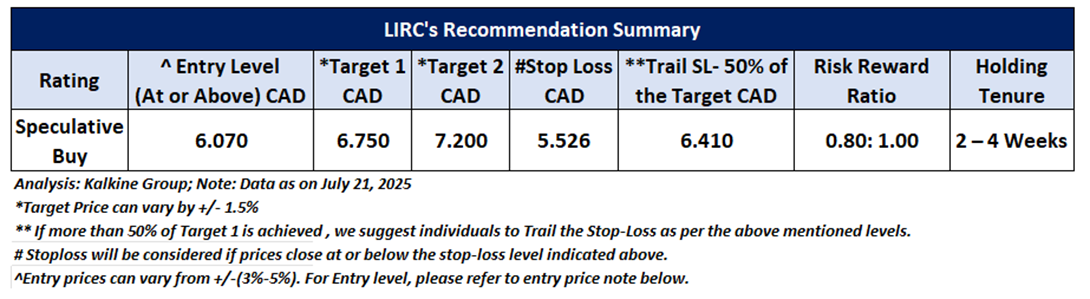
As per the above-mentioned price action and technical analysis, Lithium Royalty Corp. is looking technically well-placed on the chart, and a ‘Speculative Buy’ recommendation has been given on the stock. Investment decisions should be made depending on an individual’s appetite for upside potential, risks, and any previous holdings. This recommendation is purely based on technical analysis, and fundamental analysis has not been considered in this report. Below is the summary of our recommendation.
Upcoming Major Global Economic Events
Market events occur on a day-to-day basis depending on the frequency of the data and generally include updates on employment, inflation, GDP, consumer sentiments, etc. Noted below are the upcoming week's major global economic events that could impact the S&P/TSX Composite Index and listed stocks' prices.
Related Risks: This report may be looked at from high-risk perspective and recommendations are provided are for a short duration. Recommendations provided in this report are solely based on technical parameters, and the fundamental performance of the stocks has not been considered in the decision-making process. Other factors which could impact the stock prices include market risks, regulatory risks, interest rates risks, currency risks, social and political instability risks etc.
Note 1: Individuals can consider exiting from the stock if the Target Price or Stop loss mentioned as per the technical analysis has been achieved and subject to the factors discussed above.
Note 2: How to Read the Charts?
The Green color line reflects the 21-period moving average, while the Red color line indicates the 50-period moving average. SMA helps to identify existing price trend. If the prices are trading above the 21-period and 50-period moving average, then it shows prices are currently trading in a bullish trend.
The Black color line in the chart's lower segment reflects the Relative Strength Index (14-Period), which indicates price momentum and signals momentum in trend. A reading of 70 or above suggests overbought status, while a reading of 30 or below suggests an oversold status.
The Blue color bars in the chart's lower segment show the volume of the stock. The volume is the number of shares that changed hands during a given day. Stocks with high volumes are more liquid than stocks with lesser volume. Liquidity in stocks helps in easier and faster execution of the order.
The Orange color lines are the trend lines drawn by connecting two or more price points and used for trend identification purposes. The trend line also acts as a line of support and resistance.
Technical Indicators Defined: -
Support: A level at which the stock prices tend to find support if they are falling, and a downtrend may take a pause backed by demand or buying interest. Support 1 refers to the nearby support level for the stock and if the price breaches the level, then Support 2 may act as the crucial support level for the stock.
Resistance: A level at which the stock prices tend to find resistance when they are rising, and an uptrend may take a pause due to profit booking or selling interest. Resistance 1 refers to the nearby resistance level for the stock and if the price surpasses the level, then Resistance 2 may act as the crucial resistance level for the stock.
Stop-loss: It is a level to protect further losses in case of unfavorable movement in the stock prices.
Risk Reward Ratio: The risk reward ratio is the difference between an entry point to a stop loss and profit level. This report is based on ~80% Stop Loss of the Target 1 from the entry point.
A trailing stop-loss is a modification of stop-loss in case of favourable movement in the price to protect the gains. Individuals can Trail the Stop-Loss as per the aforementioned levels if the stock price achieves more than 50% of the Target 1. individuals should consider exiting from the position as per the Trailing Stop-Loss level if the price starts moving downwards after achieving more than 50% of the Target 1.
The reference date for all price data, currency, technical indicators, support, and resistance levels is July 21, 2025. The reference data in this report has been partly sourced from REFINITIV.
Abbreviations
CMP: Current Market Price
SMA: Simple Moving Average
CAD: Canadian Dollar
RSI: Relative Strength Index
Note: Trading decisions require a thorough analysis by individuals. Technical reports in general chart out metrics that may be assessed by individuals before any stock evaluation. The above are illustrative analytical factors used for evaluating the stocks; other parameters can be looked at along with additional risks per se. Past performance is neither an Indicator nor a guarantee of future performance.
Past performance is not a reliable indicator of future performance.

 Please wait processing your request...