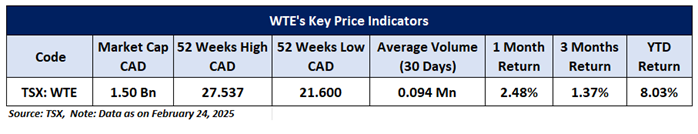
Company Overview: Westshore Terminals Investment Corporation (TSX: WTE) operates a coal storage and loading terminal at Roberts Bank, British Columbia. The company generates revenue by charging fees for loading coal onto seagoing vessels. This Report covers the Price Action, Technical Indicators Analysis along with the Stop Loss Levels, Target Prices, and Recommendation on this one stock.
Canada Market Round-Up
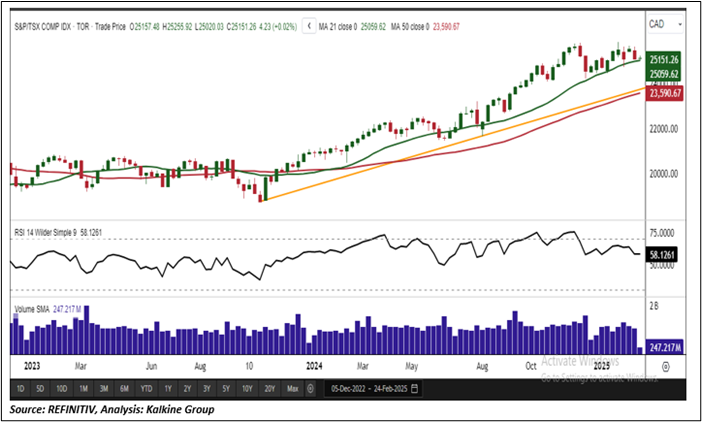
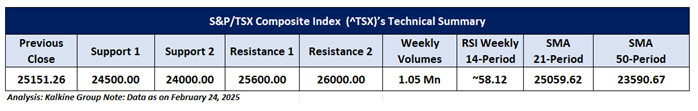
The S&P/TSX Composite Index (TSX: ^TSX) experienced a downward trend throughout last week, closing on February 21, 2025, with a decline of 336.20 points (1.32%) at 25,147.03. However, on February 24, 2025, the index saw a modest rebound, rising by 4.23 points (0.02%) to close at 25,151.26. Leading the market recovery were Consumer Non-Cyclicals, consumer cyclicals, basic materials, technology, and financials, while sectors such as energy, real estate, industrials, healthcare, and utilities underperformed. According to Statistics Canada, retail sales in Canada rose by 2.5% in December, reaching $69.6 billion. From a technical analysis perspective, the index remains above a rising trendline support zone. Additionally, it is holding above the 21-period and 50-period simple moving averages (SMAs), which could provide key support. The immediate resistance level is around 25,600, while support is near 24,500. The Relative Strength Index (RSI) on the weekly timeframe stands at approximately 58.12, signaling strong momentum.
On the macro front, the upcoming major economic events that may impact the Canadian market sentiment include CA GDP m/m, US CB Consumer Confidence and US Unemployment Claims.
Global Markets Wrap-Up
For the week ending February 21, 2025, the Nasdaq Composite declined by approximately 2.51%, closing at 19,524.01. Similarly, the Russell 2000 dropped by around 3.71%, settling at 2,195.35. According to the latest weekly report from the U.S. Department of Labor, seasonally adjusted initial jobless claims increased by 5,000 to 219,000 for the week ending February 15, 2025, compared to 214,000 in the previous week.
Taking into the US market's performance over the last week, following the major global macros and data front, based on the technical analysis of the S&P/TSX Composite Index, the one TSX listed stock fit the maximum criteria on the technical framework. The recommendations are based on the generic insights, entry price, target prices, and stop-loss for Westshore Terminals Investment Corporation (TSX: WTE) for the next 2-4 weeks.
Westshore Terminals Investment Corporation (TSX: WTE)
Price Action Analysis (On the Daily Chart)
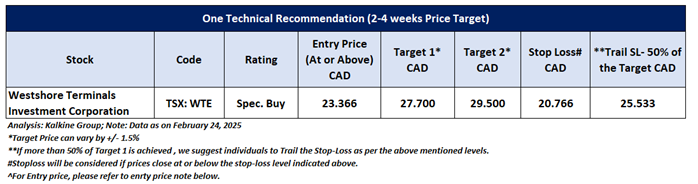
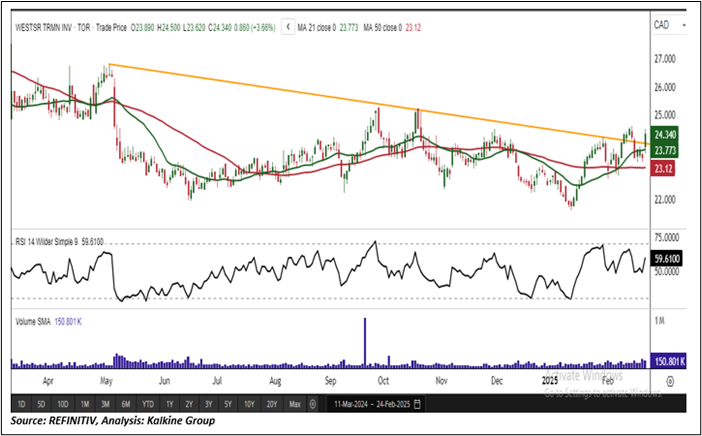
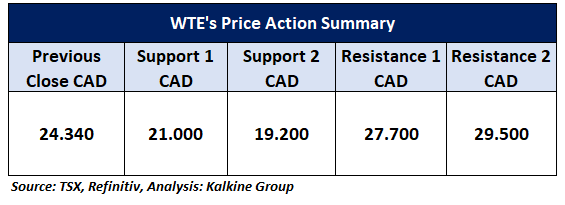
On the daily chart, WTE stock is holding above the falling trendline breakout level and consistently finding support at the trendline. The recent upward movement is accompanied by increasing trading volumes, reinforcing a bullish outlook. In the short term (2-4 weeks), the stock may test the next resistance level around CAD 27.70.
Technical Analysis (On the Daily Chart)
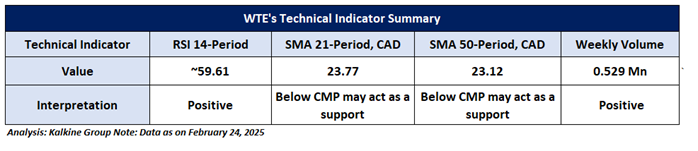
On the daily chart, the 14-period RSI is currently around 59.61, signaling positive momentum. Additionally, weekly volumes appear to support the ongoing upward movement. The stock is also trading above the 50-period simple moving average (SMA), which could serve as a key support level, further strengthening the bullish outlook.
General Recommendation:
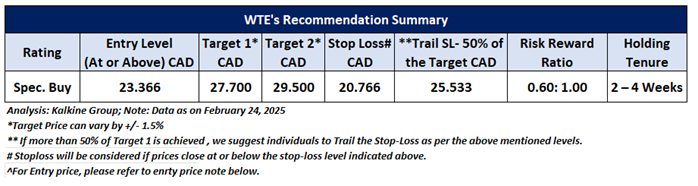
As per the above-mentioned price action and technical analysis, Westshore Terminals Investment Corporation is looking technically well-placed on the chart, and a ‘Speculative Buy’ recommendation has been given on the stock. Investment decisions should be made depending on an individual’s appetite for upside potential, risks, and any previous holdings. This recommendation is purely based on technical analysis, and fundamental analysis has not been considered in this report. Below is the summary of our recommendation.
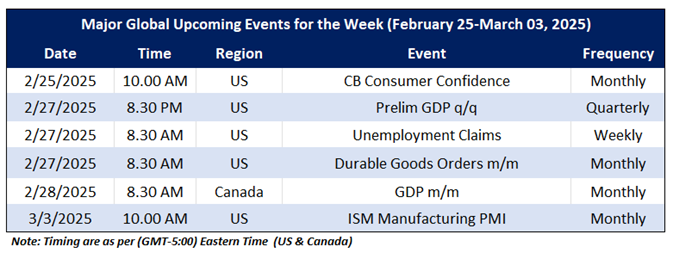
Upcoming Major Global Economic Events
Market events occur on a day-to-day basis depending on the frequency of the data and generally include updates on employment, inflation, GDP, consumer sentiments, etc. Noted below are the upcoming week's major global economic events that could impact the S&P/TSX Composite Index and listed stocks' prices.
Related Risks: This report may be looked at from high-risk perspective and recommendations are provided are for a short duration. Recommendations provided in this report are solely based on technical parameters, and the fundamental performance of the stocks has not been considered in the decision-making process. Other factors which could impact the stock prices include market risks, regulatory risks, interest rates risks, currency risks, social and political instability risks etc.
Note 1: Individuals can consider exiting from the stock if the Target Price or Stop loss mentioned as per the technical analysis has been achieved and subject to the factors discussed above.
Note 2: How to Read the Charts?
The Green color line reflects the 21-period moving average, while the Red color line indicates the 50-period moving average. SMA helps to identify existing price trend. If the prices are trading above the 21-period and 50-period moving average, then it shows prices are currently trading in a bullish trend.
The Black color line in the chart's lower segment reflects the Relative Strength Index (14-Period), which indicates price momentum and signals momentum in trend. A reading of 70 or above suggests overbought status, while a reading of 30 or below suggests an oversold status.
The Blue color bars in the chart's lower segment show the volume of the stock. The volume is the number of shares that changed hands during a given day. Stocks with high volumes are more liquid than stocks with lesser volume. Liquidity in stocks helps in easier and faster execution of the order.
The Orange color lines are the trend lines drawn by connecting two or more price points and used for trend identification purposes. The trend line also acts as a line of support and resistance.
Technical Indicators Defined: -
Support: A level at which the stock prices tend to find support if they are falling, and a downtrend may take a pause backed by demand or buying interest. Support 1 refers to the nearby support level for the stock and if the price breaches the level, then Support 2 may act as the crucial support level for the stock.
Resistance: A level at which the stock prices tend to find resistance when they are rising, and an uptrend may take a pause due to profit booking or selling interest. Resistance 1 refers to the nearby resistance level for the stock and if the price surpasses the level, then Resistance 2 may act as the crucial resistance level for the stock.
Stop-loss: It is a level to protect further losses in case of unfavorable movement in the stock prices.
Risk Reward Ratio: The risk reward ratio is the difference between an entry point to a stop loss and profit level. This report is based on ~60% Stop Loss of the Target 1 from the entry point.
A trailing stop-loss is a modification of stop-loss in case of favourable movement in the price to protect the gains. Individuals can Trail the Stop-Loss as per the aforementioned levels if the stock price achieves more than 50% of the Target 1. individuals should consider exiting from the position as per the Trailing Stop-Loss level if the price starts moving downwards after achieving more than 50% of the Target 1.
The reference date for all price data, currency, technical indicators, support, and resistance levels is February 24, 2025. The reference data in this report has been partly sourced from REFINITIV.
Abbreviations
CMP: Current Market Price
SMA: Simple Moving Average
CAD: Canadian Dollar
RSI: Relative Strength Index
Note: Trading decisions require a thorough analysis by individuals. Technical reports in general chart out metrics that may be assessed by individuals before any stock evaluation. The above are illustrative analytical factors used for evaluating the stocks; other parameters can be looked at along with additional risks per se. Past performance is neither an Indicator nor a guarantee of future performance.
Past performance is not a reliable indicator of future performance.

 Please wait processing your request...