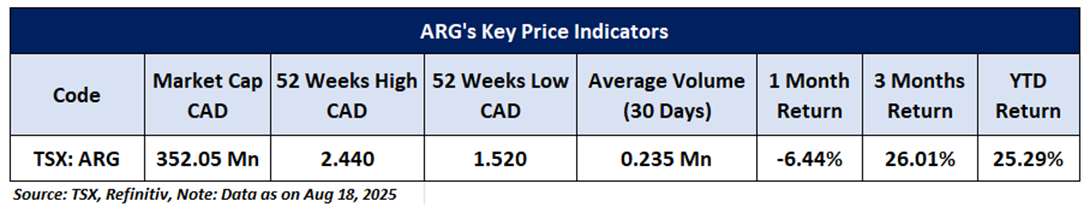
Company Overview: Ballard Power Systems Inc. (TSX: BLDP) is a global leader in proton exchange membrane (PEM) fuel cell technology, specializing in the design, development, manufacture, sale, and servicing of advanced fuel cell systems. Amerigo Resources Ltd. (TSX: ARG) is a Canadian-based company primarily engaged in the production of copper and molybdenum concentrates through its wholly owned operating subsidiary, Minera Valle Central S.A. (MVC), located in Chile. The company operates within a single business segment copper concentrate production, with molybdenum produced as a valuable by-product. This Report covers the Price Action, Technical Indicators Analysis along with the Stop Loss Levels, Target Prices, and Recommendations on these two stocks.
Canada Market Round-Up
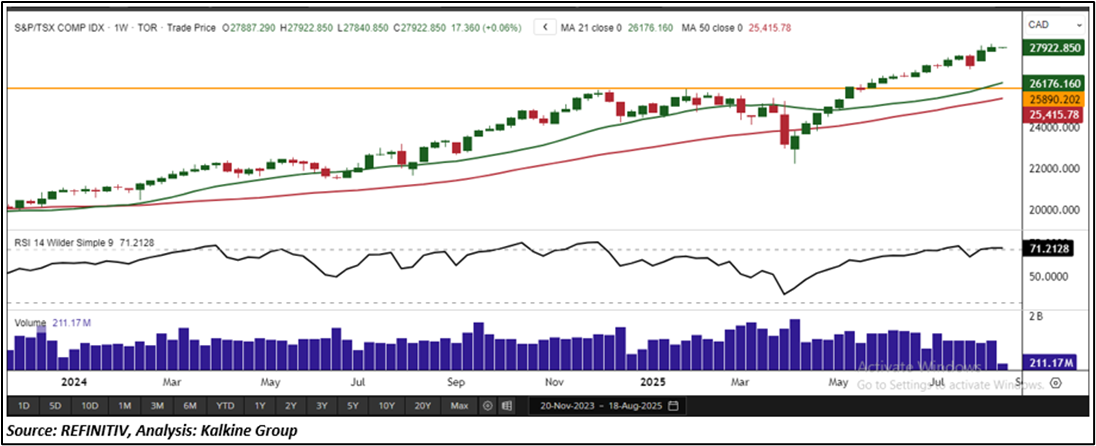
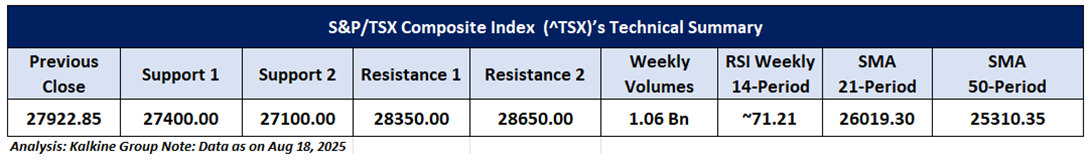
The S&P/TSX Composite Index (TSX: ^TSX) closed the week higher by 0.53%, finishing at 27,905.49, supported by broad-based sectoral strength. On August 18, the index added 17.36 points (0.06%), extending its positive momentum. Gains were driven by consumer non-cyclicals, consumer cyclicals, technology, real estate, industrials, and utilities, while healthcare, basic materials, financials, and energy underperformed, limiting the overall advance. From a technical perspective, the index continues to trade firmly above both its horizontal trendline support and the 50-period Simple Moving Average (SMA), underscoring the resilience of its bullish structure. Immediate resistance is seen near 28,350, while key support rests around 27,400. The weekly Relative Strength Index (RSI) stands at 71.21, reflecting sustained bullish momentum and ongoing buying interest. On the macro front, the upcoming major economic events that may impact the Canadian market sentiment include CA Employment Change, US ISM Services PMI and US Unemployment Claims.
Global Markets Wrap-Up
U.S. equity markets maintained bullish momentum for the week ending August 18, 2025, with major indices posting broad-based gains. The Nasdaq Composite outperformed, advancing 0.81% to close at 21,622.98, supported by strength in technology and growth-oriented sectors. The Russell 2000, a key gauge of small-cap performance, also moved higher, adding 0.35% to finish at 2,294.47, reflecting steady investor confidence in domestically focused companies. On the economic front, labor market data offered a constructive signal. The U.S. Department of Labor reported that for the week ending August 9, 2025, seasonally adjusted initial jobless claims declined by 3,000 to 224,000, compared with a revised 227,000 in the prior week.
Taking into the US market's performance over the last week, following the major global macros and data front, based on the technical analysis of the S&P/TSX Composite Index, the two TSX listed stocks fit the maximum criteria on the technical framework. The recommendations are based on the generic insights, entry price, target prices, and stop-loss for Ballard Power Systems Inc. (TSX: BLDP) and Amerigo Resources Ltd. (TSX: ARG) for the next 2-4 weeks.
Ballard Power Systems Inc. (TSX: BLDP)
Price Action Analysis (On the Daily Chart)
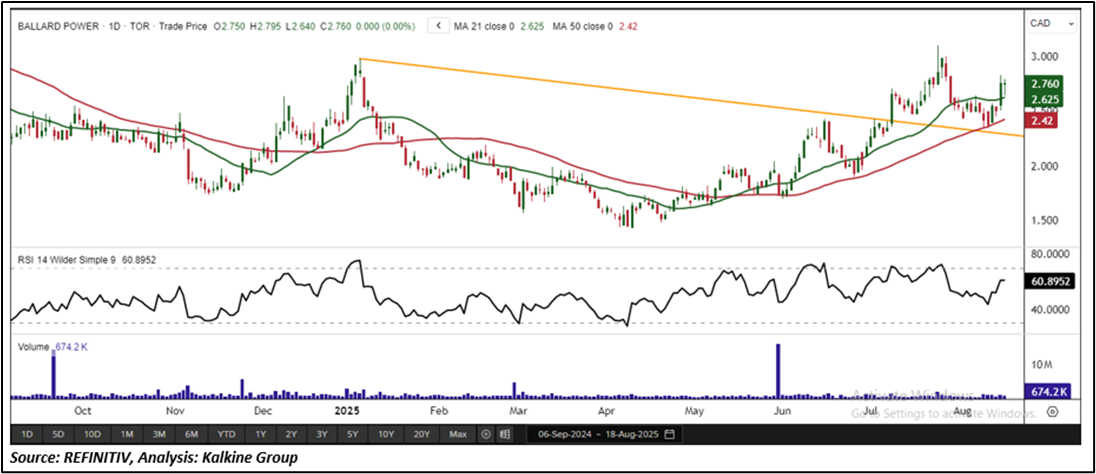
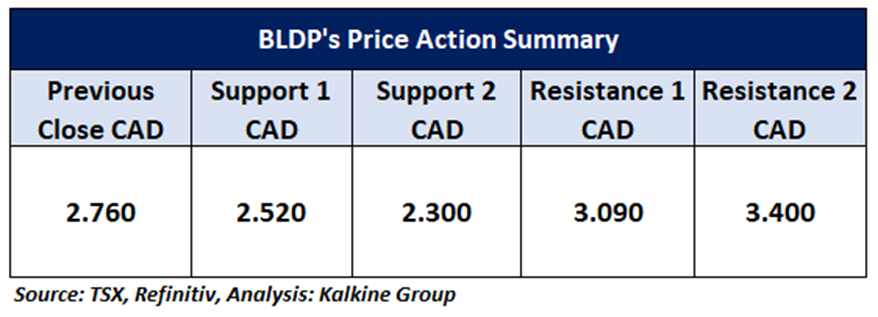
On the daily chart, BLDP is holding above a key falling trendline support, highlighting sustained buying interest at this level. The stock’s recent upward move, coupled with a noticeable rise in trading volume, points to strengthening bullish momentum and increasing market participation. In the near term, if positive sentiment persists over the next 2 to 4 weeks, BLDP looks well-positioned to retest immediate resistance around CAD 3.09. A decisive breakout above this level would shift focus to the CAD 3.40 zone, where a clear close higher could confirm the continuation of the uptrend and open the door to further upside potential.
Technical Analysis (On the Daily Chart)
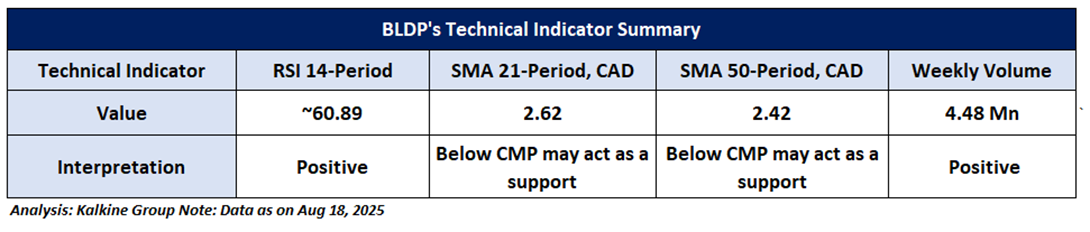
On the daily chart, the 14-period Relative Strength Index (RSI) is currently hovering around 60.89, reflecting solid momentum and suggesting scope for further upside. Weekly trading volumes remain robust, reinforcing the prevailing trend and underscoring consistent market participation. In addition, the stock is holding above its 21-period Simple Moving Average (SMA), which continues to act as a dynamic support level and further validates the constructive technical outlook.
General Recommendation:
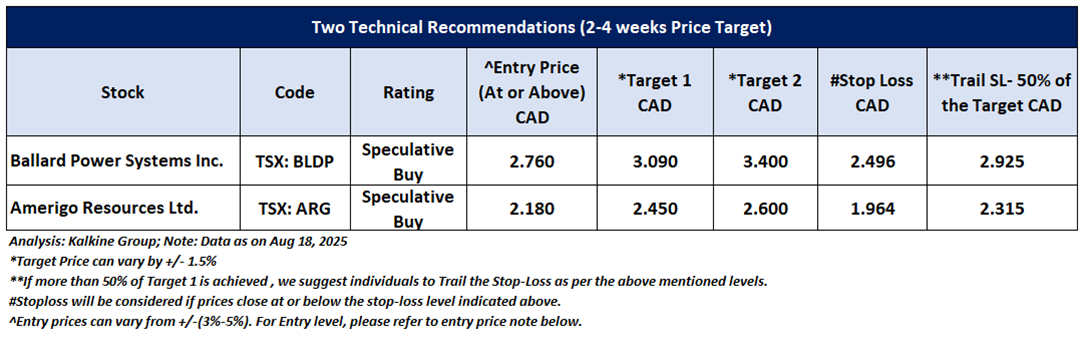
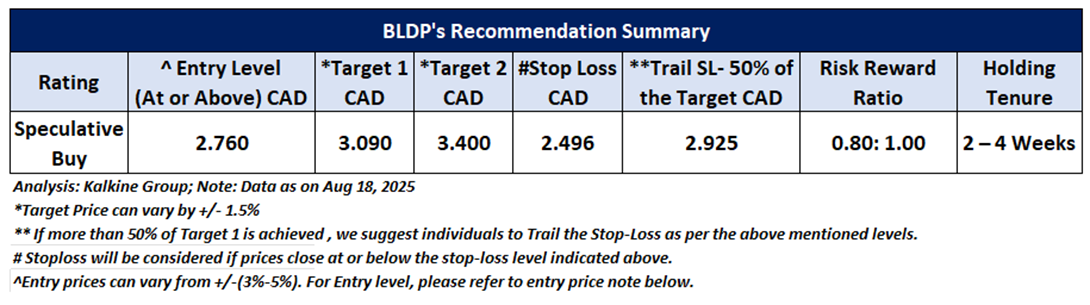
As per the above-mentioned price action and technical analysis, Ballard Power Systems Inc. looking technically well-placed on the chart, and a ‘Speculative Buy’ recommendation has been given on the stock. Investment decisions should be made depending on an individual’s appetite for upside potential, risks, and any previous holdings. This recommendation is purely based on technical analysis, and fundamental analysis has not been considered in this report. Below is the summary of our recommendation.
Amerigo Resources Ltd. (TSX: ARG)
Price Action Analysis (On the Daily Chart)
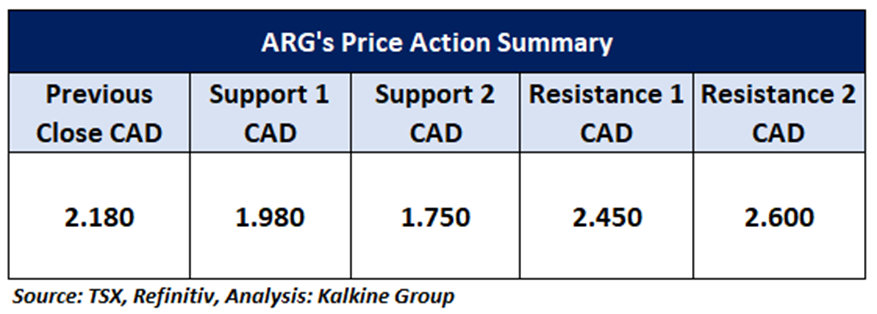
On the daily chart, ARG is trading above a key horizontal trendline support, signaling the establishment of a solid technical base. This support structure underscores the strength of the prevailing uptrend and provides a foundation for further upside potential. The stock’s recent upward movement, accompanied by rising trading volumes, reinforces the near-term bullish outlook and reflects growing investor participation. Looking ahead to the next 2 to 4 weeks, ARG appears well-positioned to retest resistance at CAD 2.45. A decisive breakout above this level would likely confirm the continuation of the uptrend, potentially triggering a fresh upward leg and unlocking further momentum-driven gains within the current bullish structure.
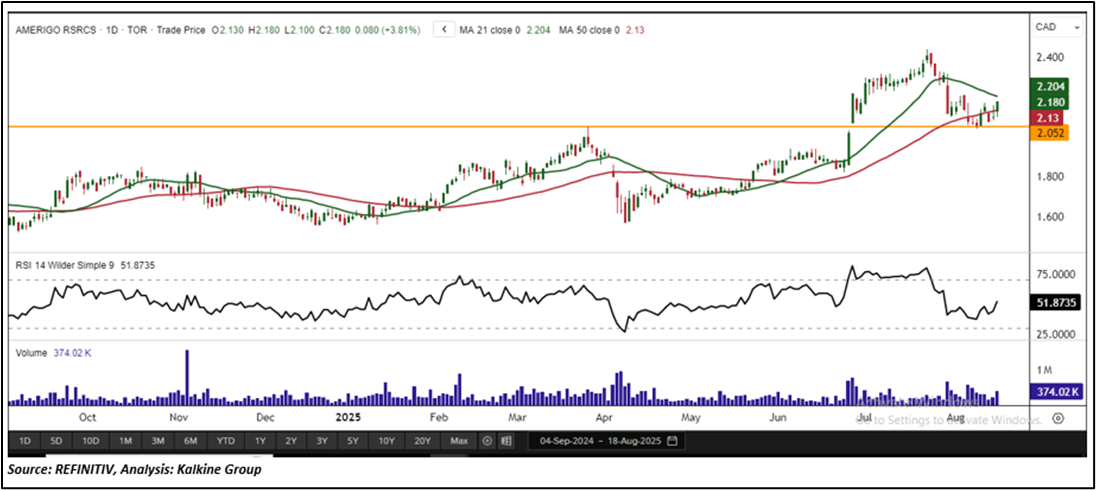
Technical Indicators Analysis (On the Daily Chart)
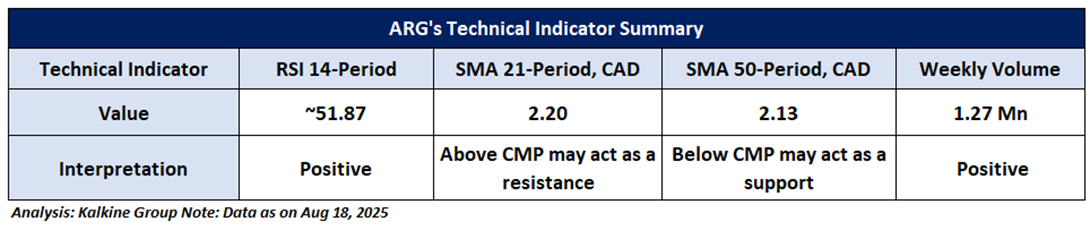
On the daily chart, the 14-period Relative Strength Index (RSI) is at approximately 51.87, indicating positive momentum and suggesting that buyers remain in control of the trend. Weekly trading volumes continue to support the recent upside, highlighting sustained investor interest and reinforcing the strength of the move. Additionally, the stock is trading above its 50-period Simple Moving Average (SMA), which now acts as dynamic support and further underpins the bullish outlook.
General Recommendation:
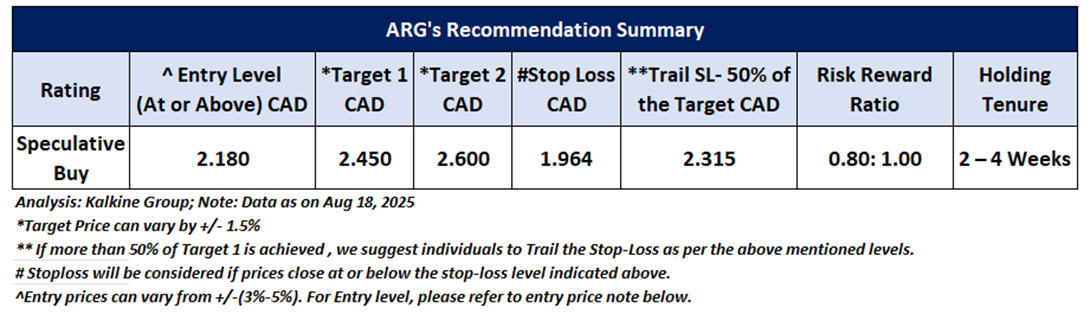
As per the above-mentioned price action and technical analysis, Amerigo Resources Ltd. looking technically well-placed on the chart, and a ‘Speculative Buy’ recommendation has been given on the stock. Investment decisions should be made depending on an individual’s appetite for upside potential, risks, and any previous holdings.This recommendation is purely based on technical analysis, and fundamental analysis has not been considered in this report. Below is the summary of our recommendation.
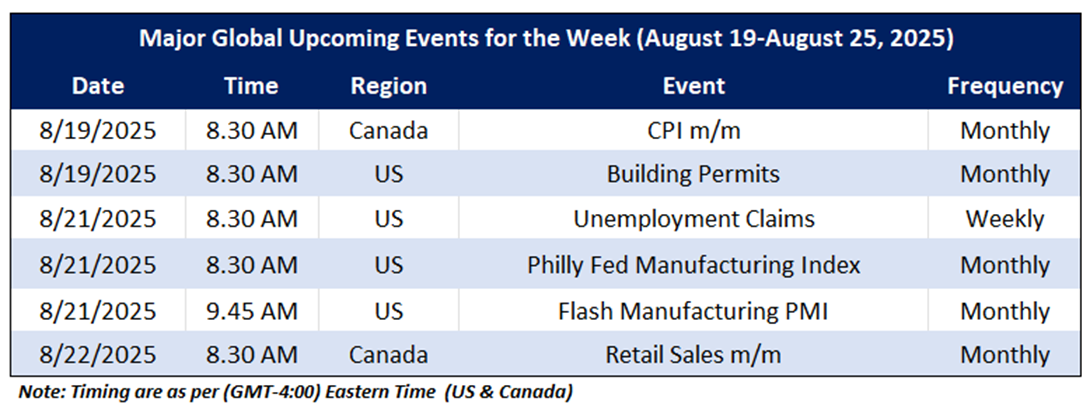
Upcoming Major Global Economic Events
Market events occur on a day-to-day basis depending on the frequency of the data and generally include updates on employment, inflation, GDP, consumer sentiments, etc. Noted below are the upcoming week's major global economic events that could impact the S&P/TSX Composite Index and listed stocks' prices.
Related Risks: This report may be looked at from high-risk perspective and recommendations are provided are for a short duration. Recommendations provided in this report are solely based on technical parameters, and the fundamental performance of the stocks has not been considered in the decision-making process. Other factors which could impact the stock prices include market risks, regulatory risks, interest rates risks, currency risks, social and political instability risks etc.
Markets are trading in a highly volatile zone currently due to certain macro-economic issues and geopolitical tensions prevailing. Therefore, it is prudent to follow a cautious approach while investing.
Note 1: Individuals can consider exiting from the stock if the Target Price or Stop loss mentioned as per the technical analysis has been achieved and subject to the factors discussed above.
Note 2: How to Read the Charts?
The Green color line reflects the 21-period moving average, while the Red color line indicates the 50-period moving average. SMA helps to identify existing price trend. If the prices are trading above the 21-period and 50-period moving average, then it shows prices are currently trading in a bullish trend.
The Black color line in the chart's lower segment reflects the Relative Strength Index (14-Period), which indicates price momentum and signals momentum in trend. A reading of 70 or above suggests overbought status, while a reading of 30 or below suggests an oversold status.
The Blue color bars in the chart's lower segment show the volume of the stock. The volume is the number of shares that changed hands during a given day. Stocks with high volumes are more liquid than stocks with lesser volume. Liquidity in stocks helps in easier and faster execution of the order.
The Orange color lines are the trend lines drawn by connecting two or more price points and used for trend identification purposes. The trend line also acts as a line of support and resistance.
Technical Indicators Defined: -
Support: A level at which the stock prices tend to find support if they are falling, and a downtrend may take a pause backed by demand or buying interest. Support 1 refers to the nearby support level for the stock and if the price breaches the level, then Support 2 may act as the crucial support level for the stock.
Resistance: A level at which the stock prices tend to find resistance when they are rising, and an uptrend may take a pause due to profit booking or selling interest. Resistance 1 refers to the nearby resistance level for the stock and if the price surpasses the level, then Resistance 2 may act as the crucial resistance level for the stock.
Stop-loss: It is a level to protect further losses in case of unfavourable movement in the stock prices.
Risk Reward Ratio: The risk reward ratio is the difference between an entry point to a stop loss and profit level. This report is based on ~80% Stop Loss of the Target 1 from the entry point.
A trailing stop-loss is a modification of stop-loss in case of favourable movement in the price to protect the gains. Individuals can Trail the Stop-Loss as per the aforementioned levels if the stock price achieves more than 50% of the Target 1. individuals should consider exiting from the position as per the Trailing Stop-Loss level if the price starts moving downwards after achieving more than 50% of the Target 1.
The reference date for all price data, currency, technical indicators, support, and resistance levels is August 18, 2025. The reference data in this report has been partly sourced from REFINITIV.
Abbreviations
CMP: Current Market Price
SMA: Simple Moving Average
CAD: Canadian Dollar
RSI: Relative Strength Index
Note: Trading decisions require a thorough analysis by individuals. Technical reports in general chart out metrics that may be assessed by individuals before any stock evaluation. The above are illustrative analytical factors used for evaluating the stocks; other parameters can be looked at along with additional risks per se. Past performance is neither an indicator nor a guarantee of future performance.
Past performance is not a reliable indicator of future performance.

 Please wait processing your request...