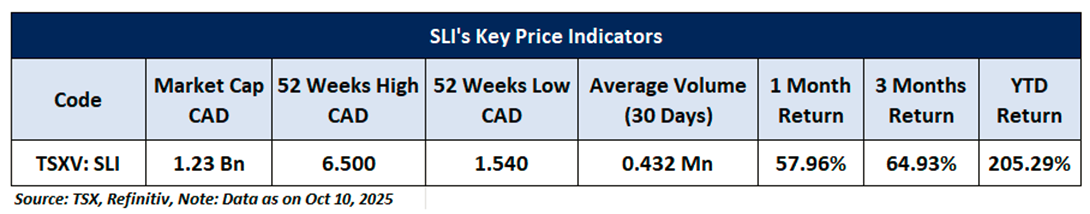
Company Overview: Hut 8 Corp. (TSX: HUT) is a vertically integrated data mining and energy infrastructure company engaged in large-scale Bitcoin mining and advanced computing operations. The company designs, builds, acquires, and manages data centers that power compute-intensive workloads, including Bitcoin mining, high-performance computing (HPC), and artificial intelligence (AI) applications. Its operations are structured across four key segments: Digital Asset Mining, Managed Services, High-Performance Computing Colocation and Cloud, and Other. Standard Lithium Corp.(TSXV: SLI) is engaged in the exploration and development of lithium brine properties across the United States. The company’s primary focus is the Arkansas Lithium Project, located in south-central Arkansas, which aims to produce high-purity lithium from brine resources using advanced extraction technologies. This Report covers the Price Action, Technical Indicators Analysis along with the Stop Loss Levels, Target Prices, and Recommendations on these two stocks.
Canada Market Round-Up
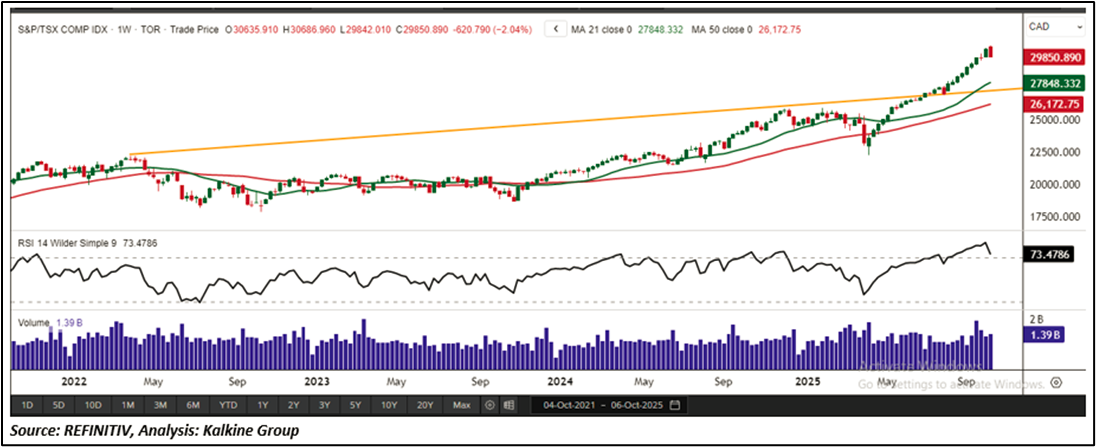
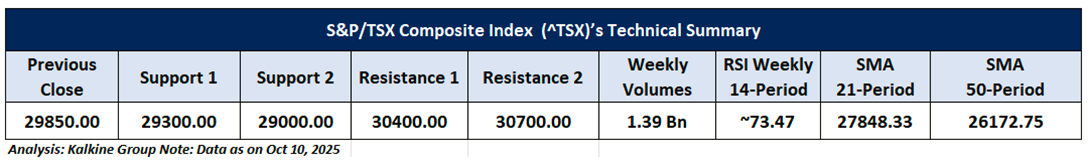
The S&P/TSX Composite Index (TSX: ^TSX) ended last week on a weaker note, declining 2.04% to close at 29,850.89. On October 10, the benchmark extended its short-term downtrend, falling 419.09 points (1.38%). Sector-wise, consumer non-cyclicals and utilities outperformed, while healthcare, technology, energy, consumer cyclicals, basic materials, industrials, real estate, and financials lagged, limiting overall market strength. From a technical perspective, the index continues to exhibit a broadly bullish structure, remaining above both its rising trendline support and the 21-period Simple Moving Average (SMA), which together reinforce the prevailing uptrend. Key resistance is positioned near 30,400; a decisive breakout above this level could pave the way for further upside. On the downside, initial support is identified at 29,300, with a sustained drop below this threshold likely to prompt a deeper short-term correction. The weekly Relative Strength Index (RSI) is at 73.47, indicating strong and sustained buying momentum. However, with the index now entering overbought territory, some near-term consolidation or profit-taking cannot be ruled out.
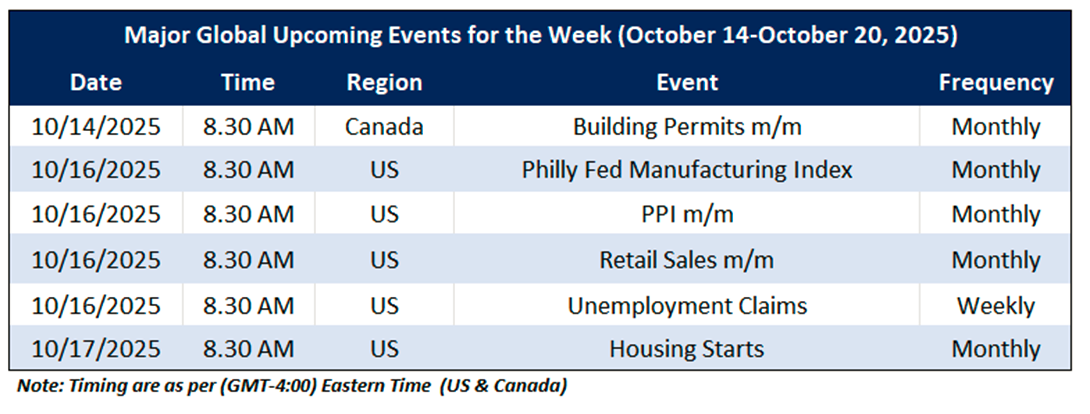
On the macro front, the upcoming major economic events that may impact the Canadian market sentiment include CA Building Permits m/m, US Retail Sales m/m and US Unemployment Claims.

Global Markets Wrap-Up
U.S. equity markets lost traction in the week ending October 10, 2025, as major indices posted broad-based declines. The Nasdaq Composite led the losses, falling 2.25% to close at 22,204.43, weighed down by weakness in technology and other growth-oriented sectors. The Russell 2000, a key gauge of small-cap performance, dropped 3.30% to finish at 2,394.59. On the economic front, data from the U.S. Department of Labor indicated improving labor market conditions, with initial jobless claims declining by 14,000 to a seasonally adjusted 218,000 for the week ending September 20, 2025, compared with the prior week’s revised total of 232,000.
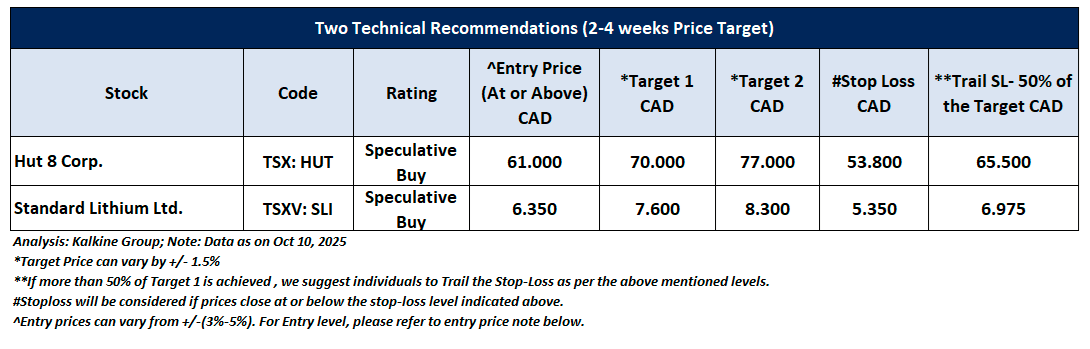
Taking into the US market's performance over the last week, following the major global macros and data front, based on the technical analysis of the S&P/TSX Composite Index, the two TSX listed stocks fit the maximum criteria on the technical framework. The recommendations are based on the generic insights, entry price, target prices, and stop-loss for Hut 8 Corp. (TSX: HUT) and Standard Lithium Corp.(TSXV: SLI) for the next 2-4 weeks.
Hut 8 Corp. (TSX: HUT)
Price Action Analysis (On the Weekly Chart)
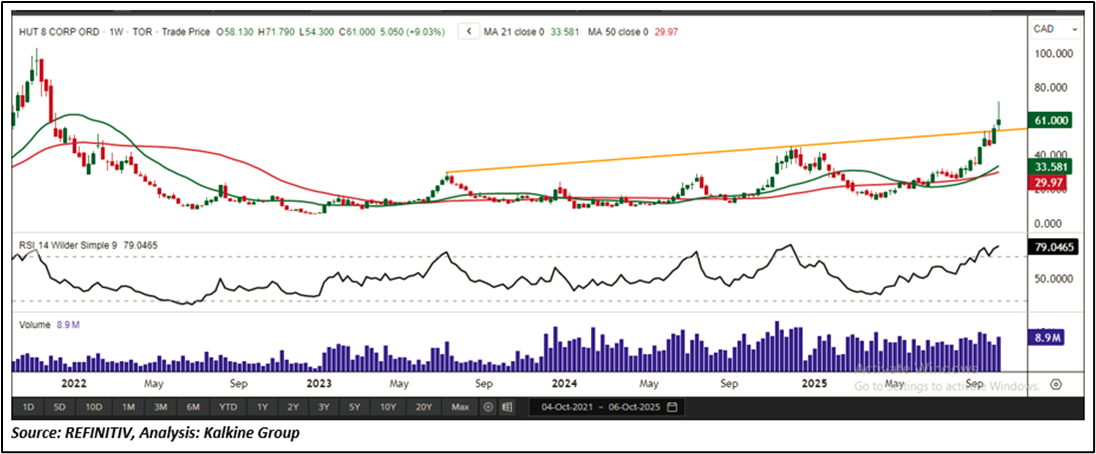
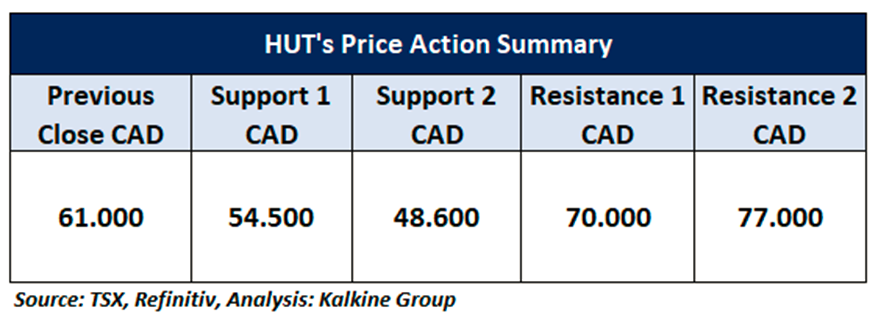
On the weekly chart, HUT is trading firmly above a rising trendline support, underscoring consistent buying interest at current levels. The stock’s recent rebound, accompanied by higher trading volumes, signals strengthening bullish momentum and growing market participation. In the near term, sustained positive sentiment over the next 2–4 weeks could set the stage for a retest of immediate resistance at CAD 70.00. A decisive breakout above this level would turn focus toward CAD 77.00, where a confirmed close higher would validate the continuation of the uptrend and unlock further upside potential.
Technical Analysis (On the Weekly Chart)
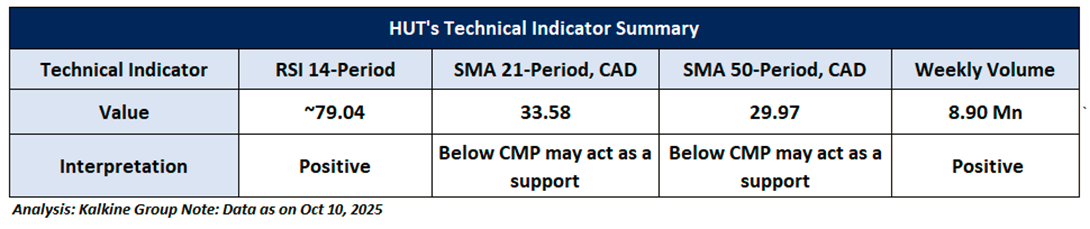
On the weekly chart, the 14-period Relative Strength Index (RSI) is hovering around 79.04, indicating strong momentum and suggesting room for additional upside. Weekly trading volumes remain elevated, reinforcing the prevailing bullish trend and reflecting sustained market participation. Moreover, the stock continues to trade above its 21-period Simple Moving Average (SMA), which serves as a dynamic support level and further strengthens the overall constructive technical outlook.
General Recommendation:
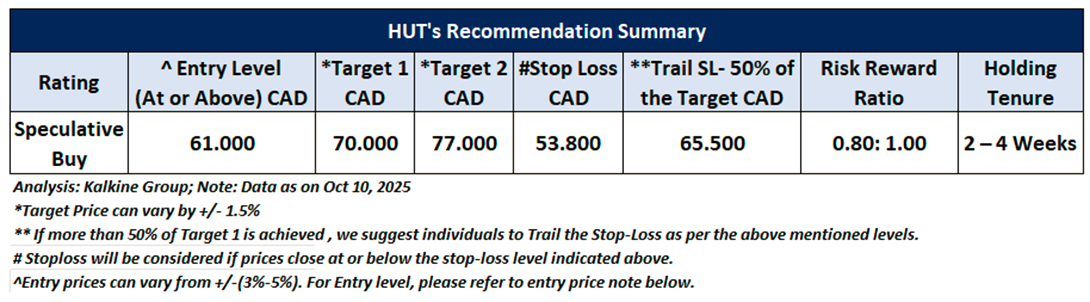
As per the above-mentioned price action and technical analysis, Hut 8 Corp. looking technically well-placed on the chart, and a ‘Speculative Buy’ recommendation has been given on the stock. Investment decisions should be made depending on an individual’s appetite for upside potential, risks, and any previous holdings. This recommendation is purely based on technical analysis, and fundamental analysis has not been considered in this report. Below is the summary of our recommendation.
Standard Lithium Corp.(TSXV: SLI)
Price Action Analysis (On the Weekly Chart)
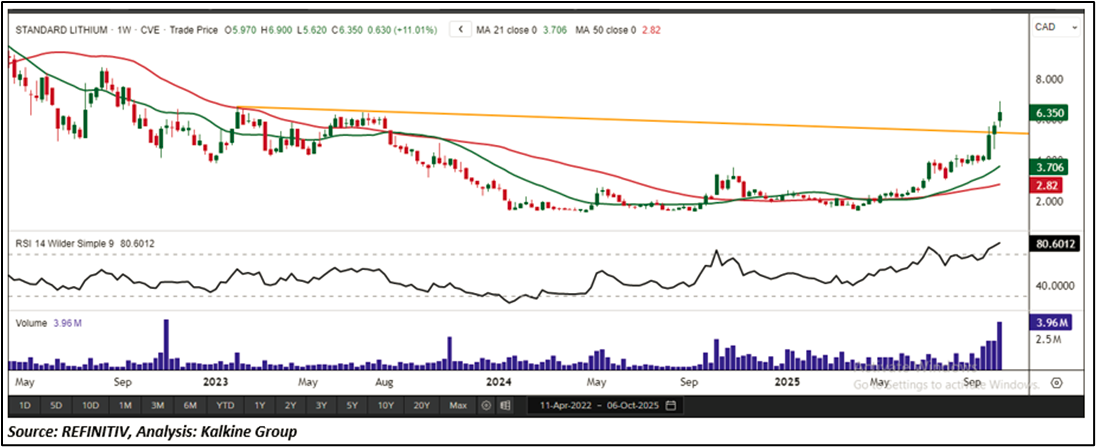
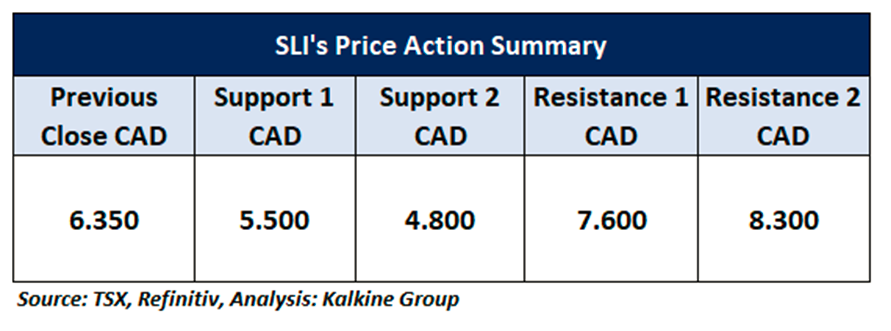
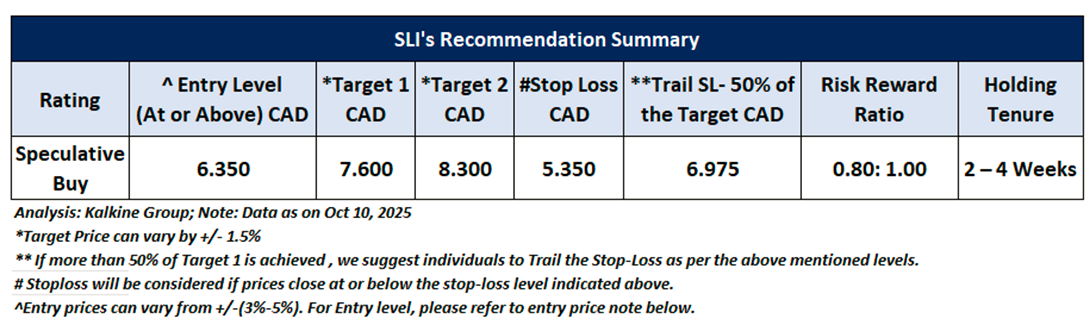
On the weekly chart, SLI is trading above a key descending trendline support, forming a solid technical base that reinforces the strength of its ongoing uptrend. This structure, coupled with the stock’s recent advance on rising volumes, signals improving market participation and supports a constructive near-term outlook. Over the next 2–4 weeks, SLI appears well-positioned to retest resistance near CAD 7.60. A decisive breakout and sustained close above this level would confirm the continuation of the uptrend, potentially triggering a fresh rally phase and unlocking further momentum-driven upside within the prevailing bullish structure.
Technical Indicators Analysis (On the Weekly Chart)
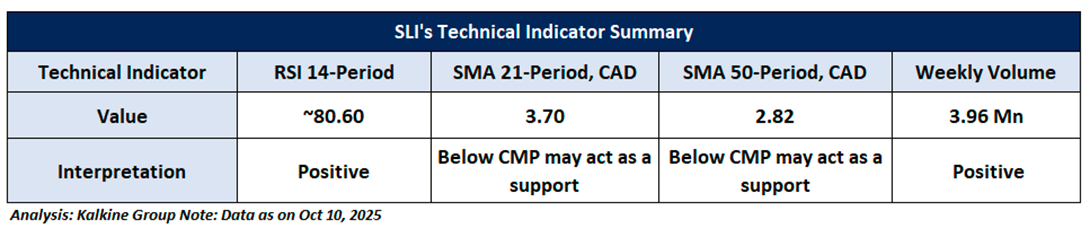
On the weekly chart, the 14-period Relative Strength Index (RSI) stands around 80.60, reflecting strong momentum and indicating that buyers remain in control. Weekly trading volumes continue to support the recent advance, highlighting sustained investor interest and reinforcing the strength of the move. Additionally, the stock is trading above its 50-period Simple Moving Average (SMA), which now serves as dynamic support and further bolsters the bullish outlook.
General Recommendation:
As per the above-mentioned price action and technical analysis, Standard Lithium Corp. looking technically well-placed on the chart, and a ‘Speculative Buy’ recommendation has been given on the stock. Investment decisions should be made depending on an individual’s appetite for upside potential, risks, and any previous holdings.This recommendation is purely based on technical analysis, and fundamental analysis has not been considered in this report. Below is the summary of our recommendation.
Upcoming Major Global Economic Events
Market events occur on a day-to-day basis depending on the frequency of the data and generally include updates on employment, inflation, GDP, consumer sentiments, etc. Noted below are the upcoming week's major global economic events that could impact the S&P/TSX Composite Index and listed stocks' prices.
Related Risks: This report may be looked at from high-risk perspective and recommendations are provided are for a short duration. Recommendations provided in this report are solely based on technical parameters, and the fundamental performance of the stocks has not been considered in the decision-making process. Other factors which could impact the stock prices include market risks, regulatory risks, interest rates risks, currency risks, social and political instability risks etc.
Markets are trading in a highly volatile zone currently due to certain macro-economic issues and geopolitical tensions prevailing. Therefore, it is prudent to follow a cautious approach while investing.
Note 1: Individuals can consider exiting from the stock if the Target Price or Stop loss mentioned as per the technical analysis has been achieved and subject to the factors discussed above.
Note 2: How to Read the Charts?
The Green color line reflects the 21-period moving average, while the Red color line indicates the 50-period moving average. SMA helps to identify existing price trend. If the prices are trading above the 21-period and 50-period moving average, then it shows prices are currently trading in a bullish trend.
The Black color line in the chart's lower segment reflects the Relative Strength Index (14-Period), which indicates price momentum and signals momentum in trend. A reading of 70 or above suggests overbought status, while a reading of 30 or below suggests an oversold status.
The Blue color bars in the chart's lower segment show the volume of the stock. The volume is the number of shares that changed hands during a given day. Stocks with high volumes are more liquid than stocks with lesser volume. Liquidity in stocks helps in easier and faster execution of the order.
The Orange color lines are the trend lines drawn by connecting two or more price points and used for trend identification purposes. The trend line also acts as a line of support and resistance.
Technical Indicators Defined: -
Support: A level at which the stock prices tend to find support if they are falling, and a downtrend may take a pause backed by demand or buying interest. Support 1 refers to the nearby support level for the stock and if the price breaches the level, then Support 2 may act as the crucial support level for the stock.
Resistance: A level at which the stock prices tend to find resistance when they are rising, and an uptrend may take a pause due to profit booking or selling interest. Resistance 1 refers to the nearby resistance level for the stock and if the price surpasses the level, then Resistance 2 may act as the crucial resistance level for the stock.
Stop-loss: It is a level to protect further losses in case of unfavourable movement in the stock prices.
Risk Reward Ratio: The risk reward ratio is the difference between an entry point to a stop loss and profit level. This report is based on ~80% Stop Loss of the Target 1 from the entry point.
A trailing stop-loss is a modification of stop-loss in case of favourable movement in the price to protect the gains. Individuals can Trail the Stop-Loss as per the aforementioned levels if the stock price achieves more than 50% of the Target 1. individuals should consider exiting from the position as per the Trailing Stop-Loss level if the price starts moving downwards after achieving more than 50% of the Target 1.
The reference date for all price data, currency, technical indicators, support, and resistance levels is October 10, 2025. The reference data in this report has been partly sourced from REFINITIV.
Abbreviations
CMP: Current Market Price
SMA: Simple Moving Average
CAD: Canadian Dollar
RSI: Relative Strength Index
Note: Trading decisions require a thorough analysis by individuals. Technical reports in general chart out metrics that may be assessed by individuals before any stock evaluation. The above are illustrative analytical factors used for evaluating the stocks; other parameters can be looked at along with additional risks per se. Past performance is neither an indicator nor a guarantee of future performance.
Past performance is not a reliable indicator of future performance.

 Please wait processing your request...