Section 1: Company Overview and Fundamental Insights:
Company Overview:
Thomson Reuters Corporation (TSX: TRI) is the result of the $17.6 billion megamerger of Canada's Thomson and the United Kingdom's Reuters Group in 2008 and the 2018 carve-out of its finance and risk business, Refinitiv, in which it holds a 45% stake. In 2019, the company agreed to exchange its 45% stake in Refinitiv for a 15% stake in LSE. Since the divestiture, the company is more concentrated on selling its flagship legal data and software, WestLaw, and its tax accounting software, OneSource. In addition, the company does hold a significant investment in the publicly traded Tradeweb, which operates a fixed income exchange.
Kalkine’s Investor Report covers the Investment Highlights, Key Financial Metrics, Risks, Technical Analysis along with the Valuation, Target Price, and Recommendation on the stock.
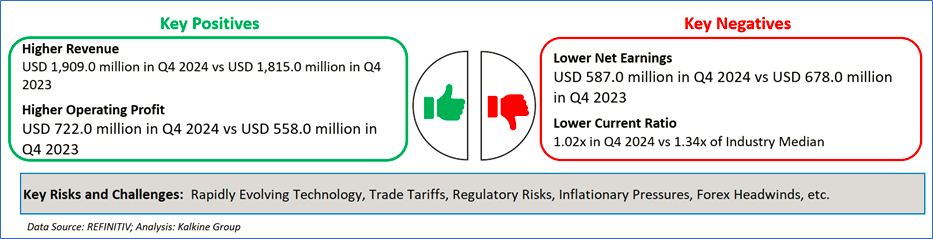
1.2 The Key Positives, Negatives, Investment Highlights and Risks
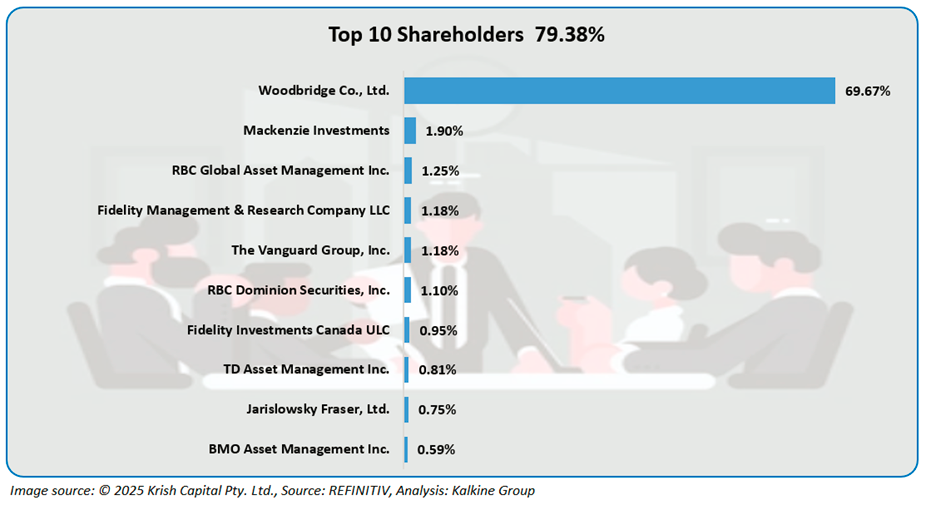
1.3 Top 10 Shareholders:
The top 10 shareholders together form ~79.38% of the total shareholding. Woodbridge Co., Ltd. and Mackenzie Investments hold a maximum stake in the company at ~69.67% and ~1.90%, respectively.
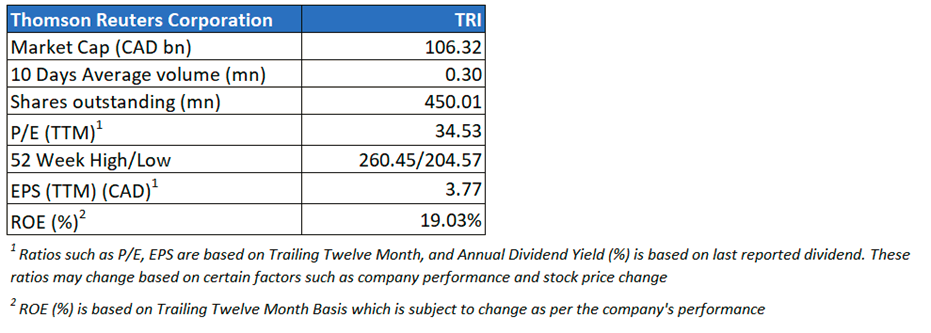
1.4 Key Metrics:
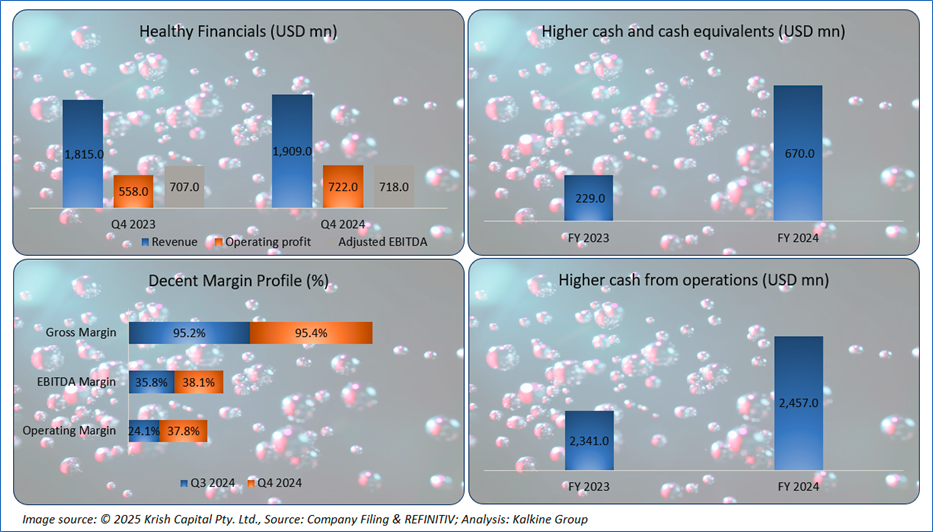
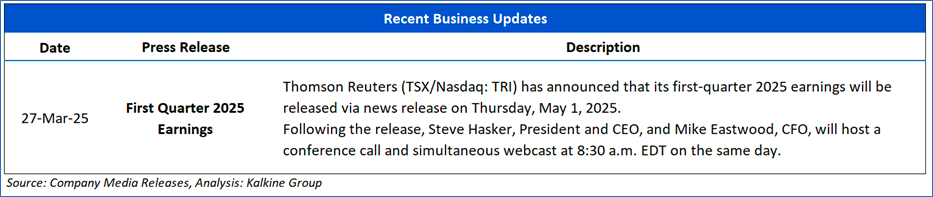
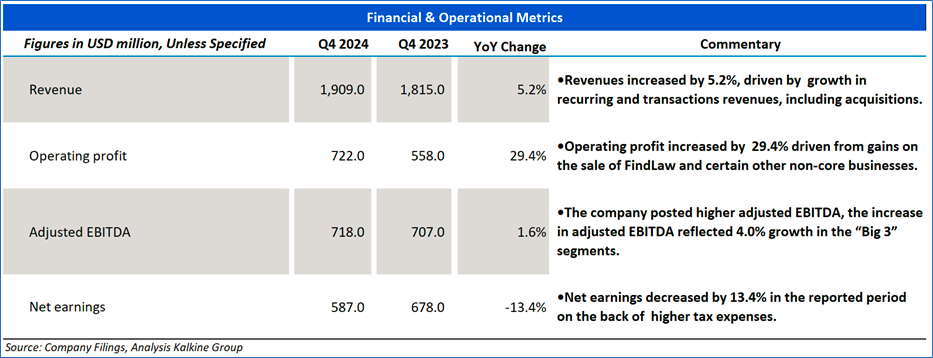
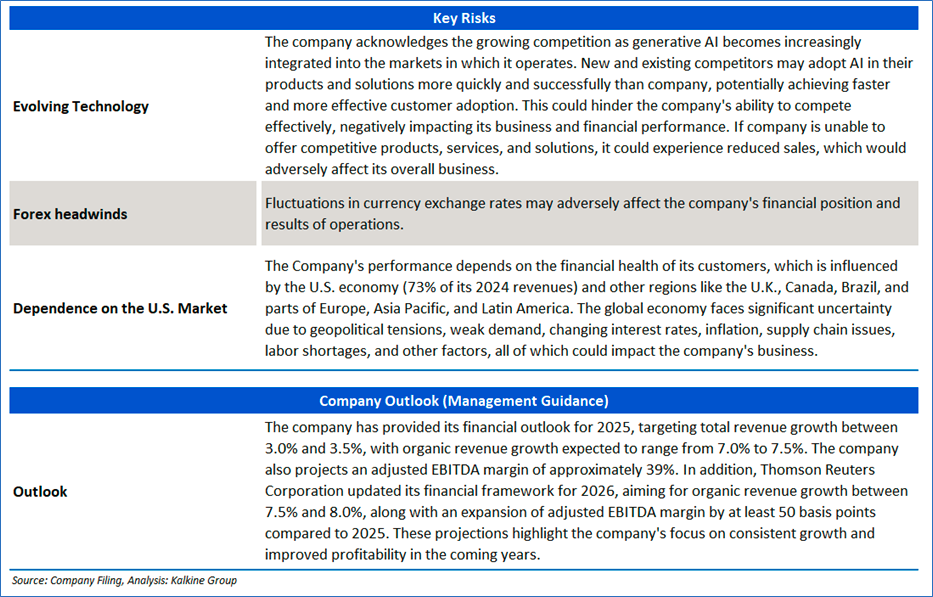
The company has reported an increase in its revenue and operating profit in Q4 2024, which is a key positive. Furthermore, the company has reported higher cash from operations, which is a significant plus.
Section 2: Business Updates and Financial Highlights
2.1 Recent Updates: The below picture gives an update on the company’s upcoming earnings release.
2.2 Insights on Q4 2024 Financial Performance:
Section 3: Key Risks and Company Outlook
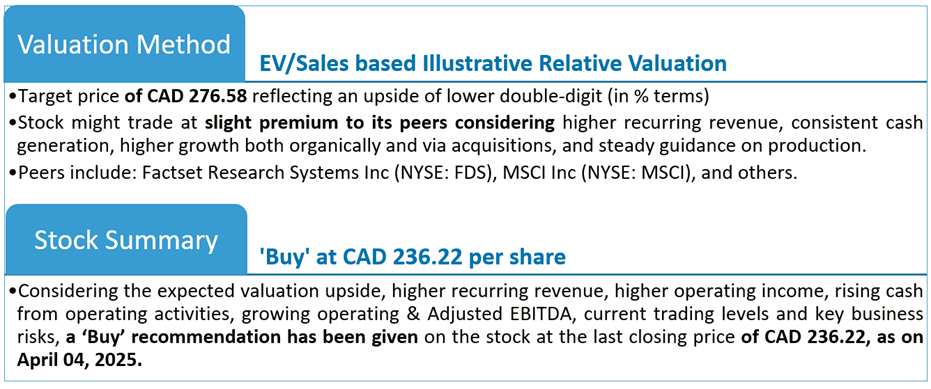
Section 4: Stock Recommendation Summary:
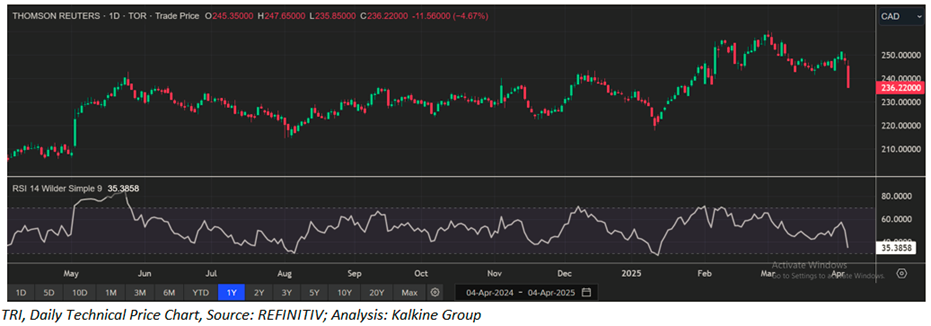
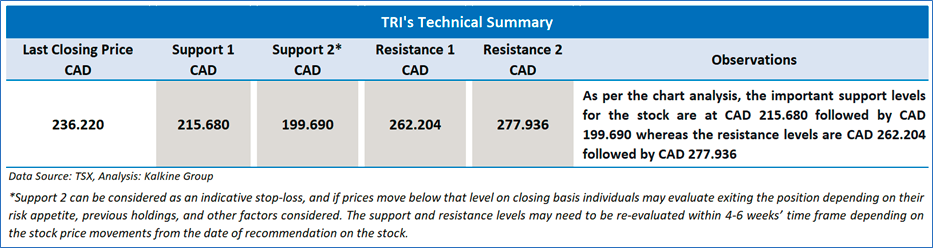
4.1 Price Performance and Technical Summary:

The stock has witnessed a downside of ~3.46 and ~6.41% over the last 1 week and 1 month respectively. Moreover, the stock is trading above the average 52-week high price of CAD 260.45 and 52-week low price of CAD 204.57, providing an opportunity to ride the stock.
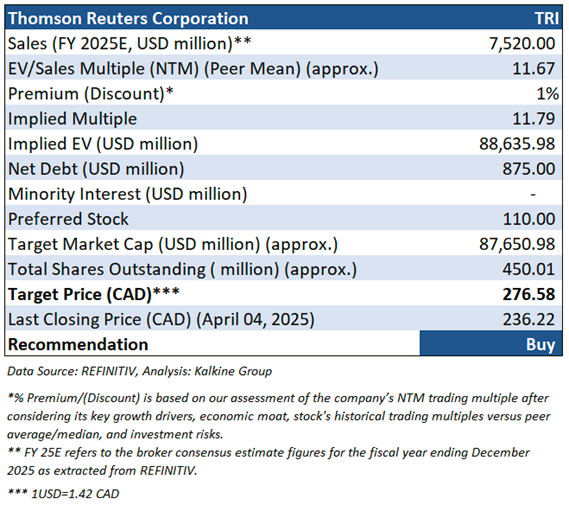
4.2 Fundamental Valuation
Valuation Methodology: EV to Sales Multiple Based Relative Valuation (Illustrative)
Markets are trading in a highly volatile zone currently due to certain macroeconomic issues and geopolitical tensions prevailing. Therefore, it is prudent to follow a cautious approach while investing.
Note 1: Past performance is not a reliable indicator of future performance.
Note 2: The reference date for all price data, currency, technical indicators, support, and resistance levels is April 04, 2025. The reference data in this report has been partly sourced from REFINITIV.
Note 3: Investment decisions should be made depending on an individual's appetite for upside potential, risks, holding duration, and any previous holdings. An 'Exit' from the stock can be considered if the Target Price mentioned as per the Valuation and or the technical levels provided has been achieved and is subject to the factors discussed above.
Note 4: Dividend Yield may vary as per the stock price movement.
Note 5: Kalkine reports are prepared based on the stock prices captured either from REFINITIV or Trading View. Typically, REFINITIV or Trading View may reflect stock prices with a delay which could be a lag of 25-30 minutes. There can be no assurance that future results or events will be consistent with the information provided in the report. The information is subject to change without any prior notice.
Technical Indicators Defined: -
Support: A level at which the stock prices tend to find support if they are falling, and a downtrend may take a pause backed by demand or buying interest. Support 1 refers to the nearby support level for the stock and if the price breaches the level, then Support 2 may act as the crucial support level for the stock.
Resistance: A level at which the stock prices tend to find resistance when they are rising, and an uptrend may take a pause due to profit booking or selling interest. Resistance 1 refers to the nearby resistance level for the stock and if the price surpasses the level, then Resistance 2 may act as the crucial resistance level for the stock.
Stop-loss: It is a level to protect further losses in case of unfavourable movement in the stock prices.
Past performance is not a reliable indicator of future performance.

 Please wait processing your request...