Section 1: Introduction
- Inflation is the gradual loss in purchasing power, primarily due to an increase in the price levels of goods and services over a given period.
- The Consumer Price Index (CPI) rose 1.9% in January on a yearly basis, following an increase of 1.8% in December. In January, energy prices rose 5.3% following a 1.0% increase in December, mainly due to the higher prices for gasoline and natural gas, which has made a significant contribution to the rising Inflation. These price increases were partly offset by the continued downward pressure on prices for products affected by the goods and services tax.
- On a monthly basis, the CPI rose 0.1% in January compared with a 0.4% decline in December. On a seasonally adjusted monthly basis, the CPI rose 0.1% in January.
- There are two types of inflationary trends - high and low inflation. The cycles of high and low inflation mainly depend on policy action by the Government to balance the demand and growth of the country.
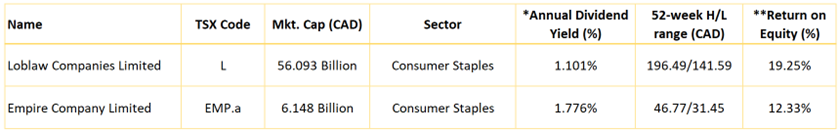
- Loblaw Companies Limited (TSX: L) is one of Canada's largest grocery, pharmacy, and general merchandise retailers, operating the most expansive store footprint in Ontario and maintaining sizable presences in provinces like Quebec and British Columbia.
- Empire Company Limited (TSX: EMP.a) key businesses are food retailing, investments, and other operations. The food retailing division operates through Empire's subsidiary Sobeys and represents nearly all the company's income. Since, Loblaw and Empire Company limited are catering into consumer staples products, which consumers can’t deter or defer buying, showcasing lower beta stocks, hence, these consumer staples stocks will remain mostly indifferent and have potential to generate good returns even in rising Inflation Scenario.
Loblaw Companies Limited
Section 2: Company Overview
Loblaw Companies Limited (TSX: L) is one of Canada's largest grocery, pharmacy, and general merchandise retailers, operating the most expansive store footprint in Ontario and maintaining sizable presences in provinces like Quebec and British Columbia. Key grocery banners include Loblaw, No Frills, and Maxi, while its pharmaceutical operations are the product of its 2014 acquisition of Shoppers Drug Mart. The firm carries a robust private-label assortment, with top sellers like President's Choice and No Name. In addition to its retail operations, Loblaw oversees a financial services business, which provides credit card services and guaranteed investment certificates, and operates its PC Optimum loyalty program. Kalkine’s Inflation Report covers the Investment Highlights, Key Financial Metrics, Risks, Technical Analysis along with the Valuation, Target Price, and Recommendation on the stock.
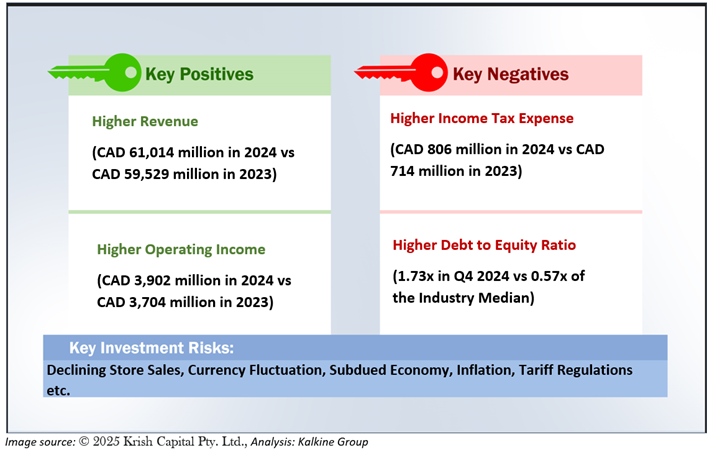
2.1 The Key Positives, Negatives, Investment Highlights, and Risks
Section 3: Financial Highlights
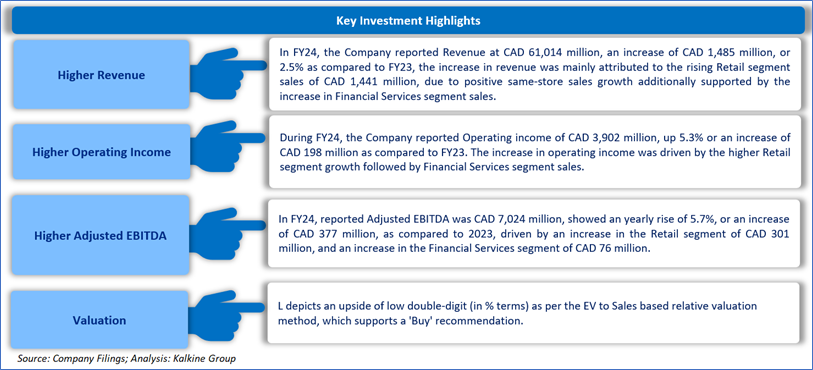
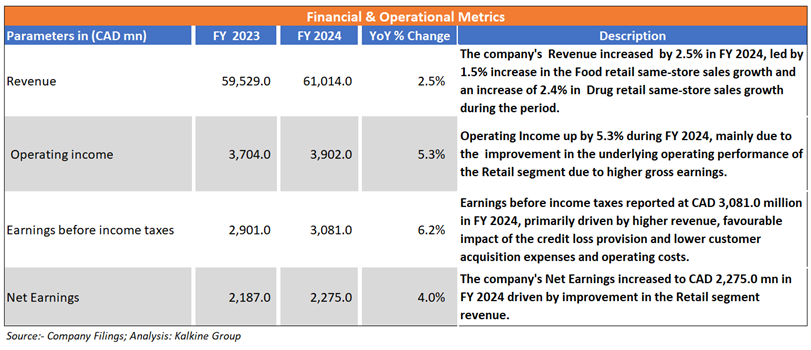
3.1 Key Financial Highlights
Section 4: Key Metrics
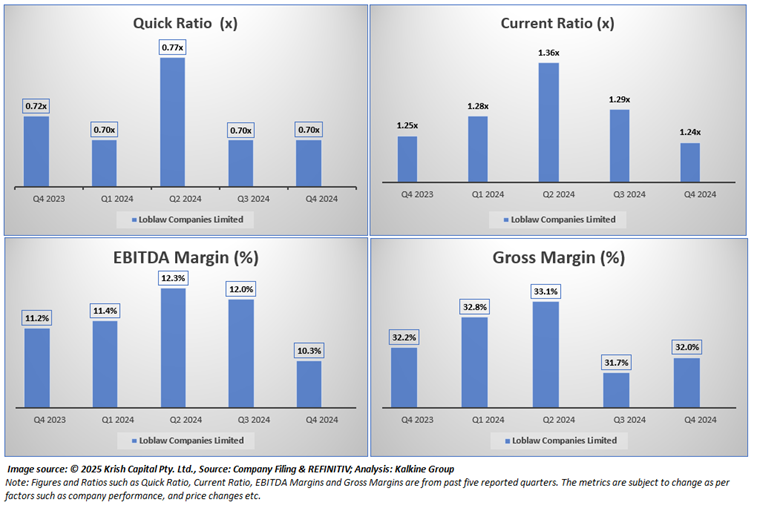
Below chart depict the change in Gross Margin, EBITDA Margin, Quick Ratio and Current Ratio of the Company for the last five reported quarters.
Section 5: Stock Recommendation Summary
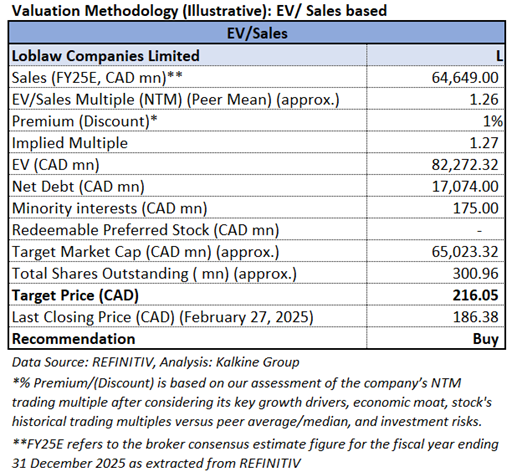
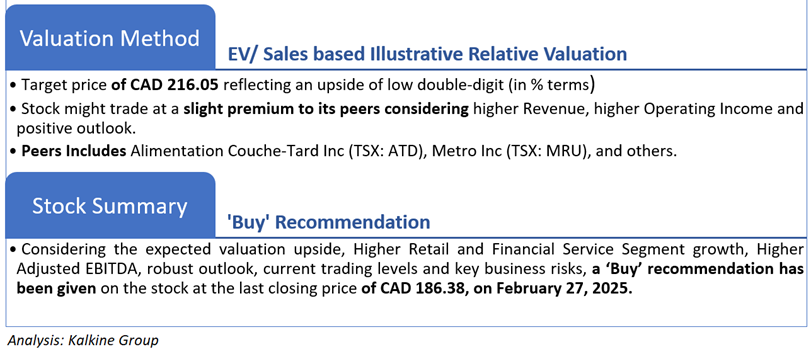
5.1 Valuation Methodology Illustrative EV to Sales Based
5.2 Price Performance and Stock Recommendation

The stock has witnessed an upside of ~1.02% in 1 month and of ~2.43% over the last 3 months. Moreover, the stock is trading above the average of the 52-week high price of CAD 196.49 and the 52-week low price of CAD 141.59, providing an opportunity to ride the trend.
5.3 One-Year Technical Price Chart
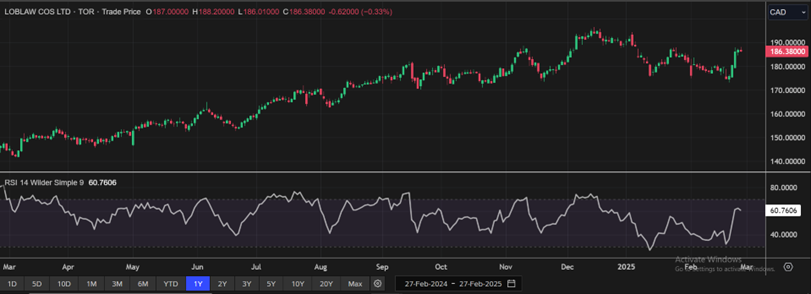
One-Year Technical Price Chart (as of February 27, 2025). Source: REFINITIV, Analysis: Kalkine Group
5.4 Technical Summary

Empire Company Limited
Section 1: Company Overview
Empire Co Ltd (TSX: EMP.a) key businesses are food retailing, investments, and other operations. The food retailing division operates through Empire's subsidiary Sobeys and represents nearly all of the company's income. This segment owns, affiliates, or franchises more than 1,500 stores in 10 provinces, under retail banners including Sobeys, Safeway, IGA, Foodland, FreshCo, Thrifty Foods, Lawton's Drug Stores, and multiple retail fuel locations. The company's investment and other operations segment include the investment in Crombie REIT, which is an open-ended Canadian real estate investment trust, as well as the Genstar Development Partnership. Kalkine’s Inflation Report covers the Investment Highlights, Key Financial Metrics, Risks, Technical Analysis along with the Valuation, Target Price, and Recommendation on the stock.
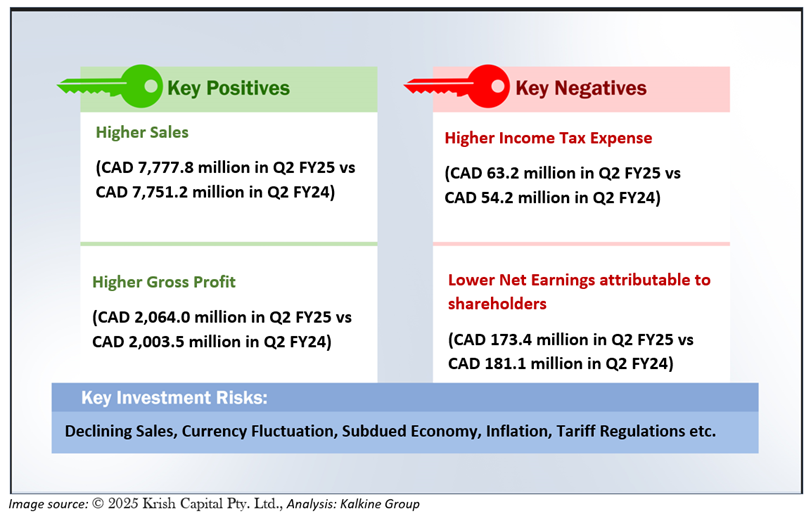
1.1 The Key Positives, Negatives, Investment Highlights, and Risks
Section2: Financial Highlights
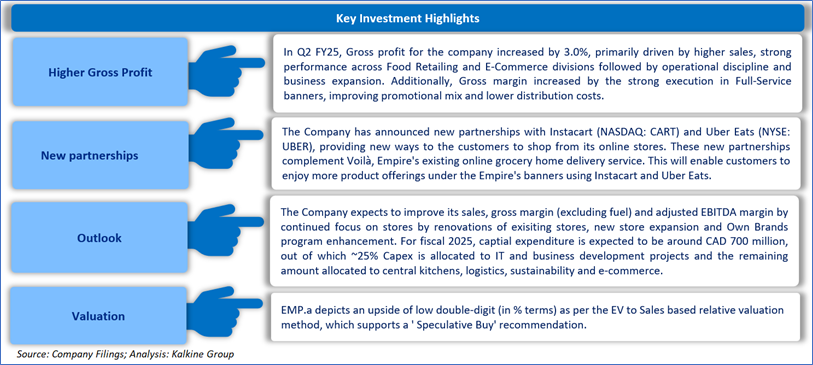
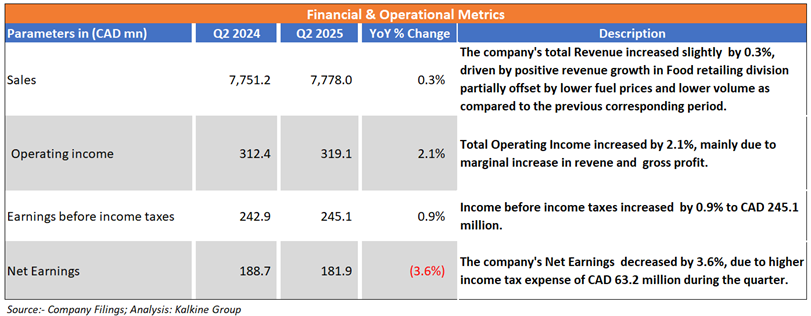
2.1 Key Financial Highlights
Section 3: Key Metrics
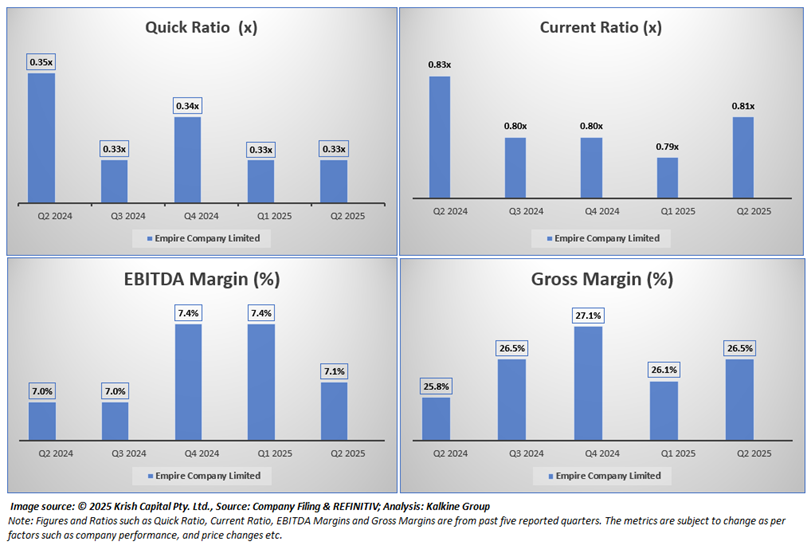
Below chart depicts the change in Gross Margin, EBITDA Margin, Quick Ratio and Current Ratio of the Company for the last five reported quarters.
Section 4: Stock Recommendation Summary
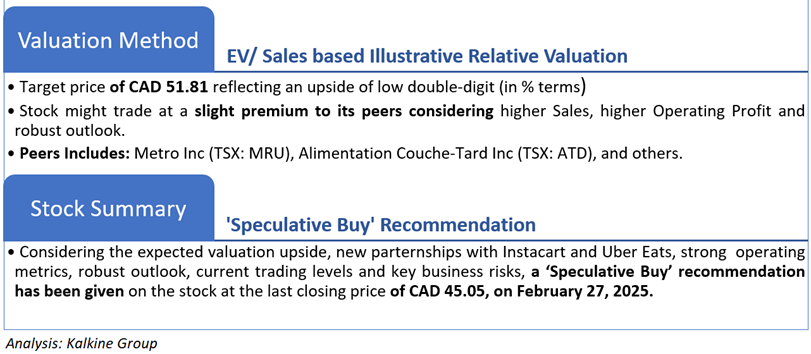
4.1 Valuation Methodology Illustrative EV to Sales Based
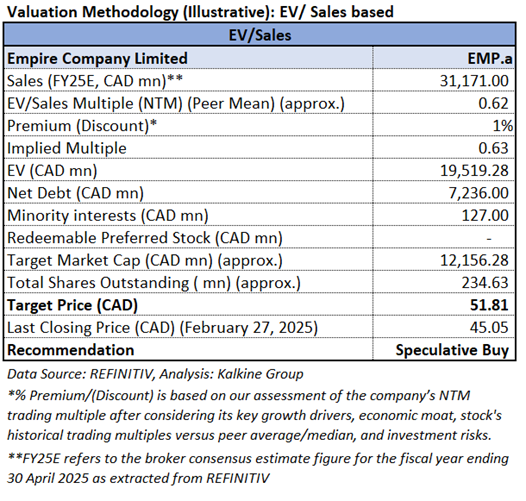
4.2 Price Performance and Stock Recommendation

The stock has witnessed an upside of ~5.28% in 1 month and an upside of ~6.62% over the last 3 months. Moreover, the stock is trading above the average of 52-week high price of CAD 46.77 and 52-week low price of CAD 31.45, providing an opportunity to ride the trend.
4.3 One-Year Technical Price Chart

One-Year Technical Price Chart (as of February 27, 2025). Source: REFINITIV, Analysis: Kalkine Group
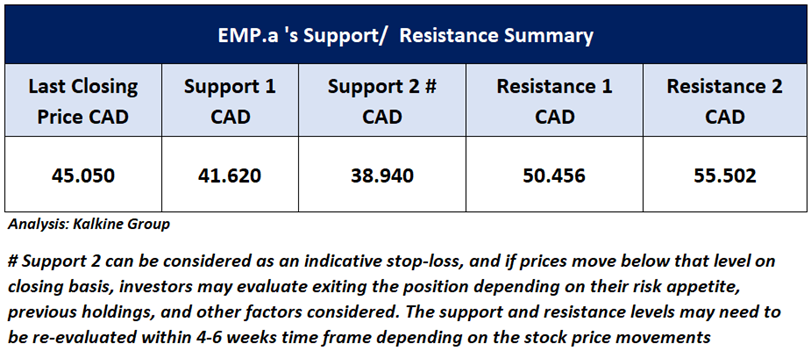
4.4 Technical Summary
Note 1: Past performance is not a reliable indicator of future performance.
Note 2: The reference date for all price data, currency, technical indicators, support, and resistance levels is February 27, 2025. The reference data in this report has been partly sourced from REFINITIV.
Note 3: Investment decisions should be made depending on an individual's appetite for upside potential, risks, holding duration, and any previous holdings. An 'Exit' from the stock can be considered if the Target Price mentioned as per the Valuation and or the technical levels provided has been achieved and is subject to the factors discussed above.
Note 4: Dividend Yield may vary as per the stock price movement.
Note 5: Kalkine reports are prepared based on the stock prices captured either from REFINITIV or Trading View. Typically, REFINITIV or Trading View may reflect stock prices with a delay which could be a lag of 25-30 minutes. There can be no assurance that future results or events will be consistent with the information provided in the report. The information is subject to change without any prior notice.’
Technical Indicators Defined: -
Support: A level at which the stock prices tend to find support if they are falling, and a downtrend may take a pause backed by demand or buying interest.
Resistance: A level at which the stock prices tend to find resistance when they are rising, and the uptrend may take a pause due to profit booking or selling interest.
Stop-loss: In general, it is a level to protect further losses in case of any unfavourable movement in the stock prices.
Past performance is not a reliable indicator of future performance.

 Please wait processing your request...