Section 1: Introduction
- Inflation is the gradual loss in purchasing power, primarily due increase in the price levels of goods and services over a given period.
- The Consumer Price Index (CPI) rose 1.9% on a year-over-year basis in November, down from a 2.0% increase in October. Slower price growth was broad-based, with prices for travel tours and the mortgage interest cost index contributing the most to the deceleration. Excluding gasoline, the all-items CPI rose 2.0% in November, following a 2.2% gain in October.
- On a monthly basis, the CPI was unchanged in November, following a 0.4% increase in October. On a seasonally adjusted monthly basis, the CPI rose 0.1%.
- There are two types of inflationary trends - high and low inflation. The cycles of high and low inflation mainly depend on policy action by the Government to balance the demand and growth of the country.
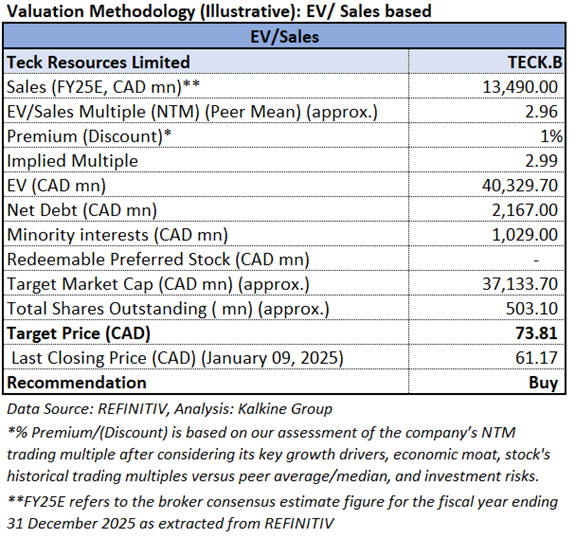
- Teck Resources Limited (TSX: Teck.b) is a diversified miner with coal, copper, zinc, and oil sands operations in Canada, the United States, Chile, and Peru.

Teck Resources Limited
Section 1: Company Overview
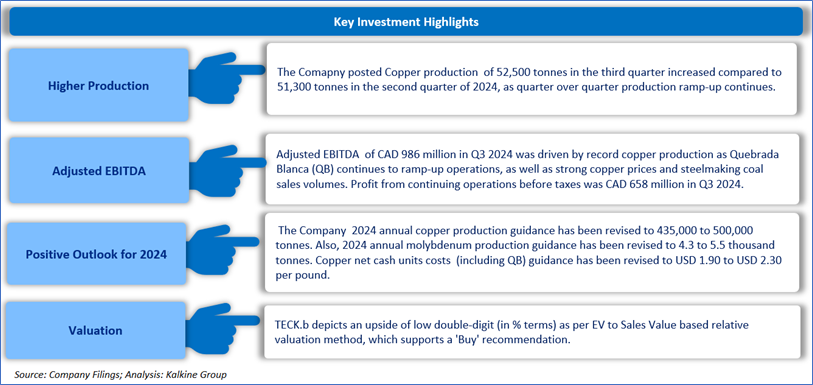
Teck Resources Limited (TSX: Teck.b) is a diversified miner with coal, copper, zinc, and oil sands operations in Canada, the United States, Chile, and Peru. Metallurgical coal is Teck's primary commodity in terms of EBITDA contribution, closely followed by copper, with zinc and oil sands contributing smaller amounts to earnings. Teck ranks as the world's second- largest exporter of seaborne metallurgical coal and is a top three zinc miner. Kalkine’s Inflation Report covers the Investment Highlights, Key Financial Metrics, Risks, Technical Analysis along with the Valuation, Target Price, and Recommendation on the stock.
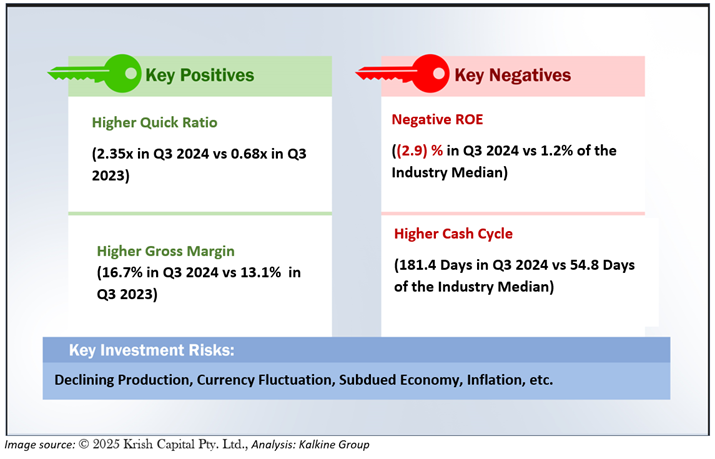
1.1 The Key Positives, Negatives, Investment Highlights, and Risks
Section2: Financial Highlights
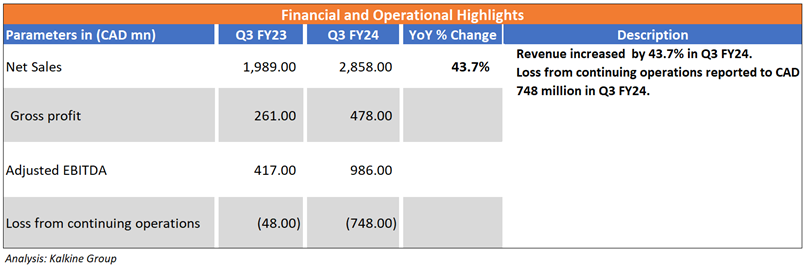
2.1 Key Financial Highlights
Section 3: Key Metrics
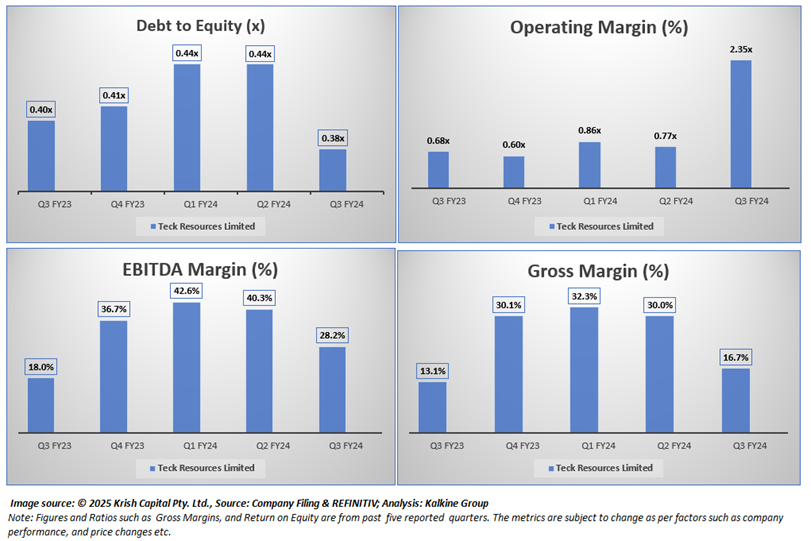
Below charts depict the change in Debt to Equity, Gross Margin, Operating Margin of the Company for the last five reported quarters.
Section 4: Stock Recommendation Summary
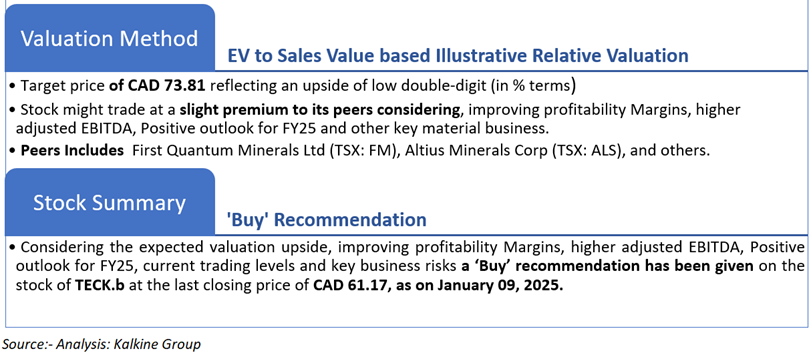
4.1 Valuation Methodology Illustrative EV to Sales Based
4.2 Price Performance and Stock Recommendation

The stock has witnessed a downside of ~5.13% in 1 month and a downside of ~11.68% over the last 3 months. Moreover, the stock is trading slightly above the average of 52-week high price of CAD 74.37 and 52-week low price of CAD 49.30 providing an opportunity to ride the trend.
4.3 One-Year Technical Price Chart
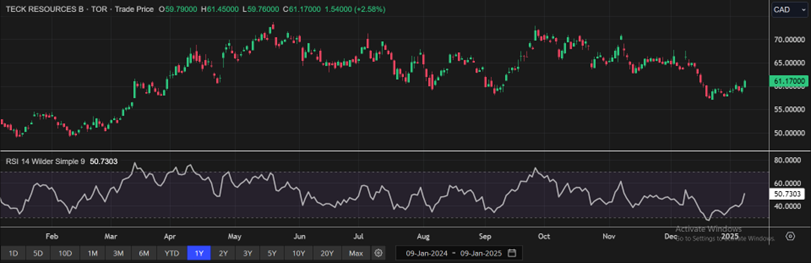
One-Year Technical Price Chart (as of January 09, 2025). Source: REFINITIV, Analysis: Kalkine Group
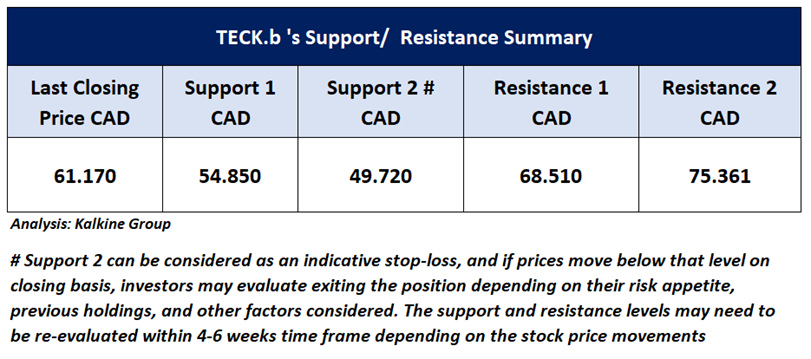
4.4 Technical Summary
Note 1: Past performance is not a reliable indicator of future performance.
Note 2: The reference date for all price data, currency, technical indicators, support, and resistance levels is January 09, 2025. The reference data in this report has been partly sourced from REFINITIV.
Note 3: Investment decisions should be made depending on an individual's appetite for upside potential, risks, holding duration, and any previous holdings. An 'Exit' from the stock can be considered if the Target Price mentioned as per the Valuation and or the technical levels provided has been achieved and is subject to the factors discussed above.
Note 4: Dividend Yield may vary as per the stock price movement.
Note 5: Kalkine reports are prepared based on the stock prices captured either from REFINITIV or Trading View. Typically, REFINITIV or Trading View may reflect stock prices with a delay which could be a lag of 25-30 minutes. There can be no assurance that future results or events will be consistent with the information provided in the report. The information is subject to change without any prior notice.’
Technical Indicators Defined: -
Support: A level at which the stock prices tend to find support if they are falling, and a downtrend may take a pause backed by demand or buying interest.
Resistance: A level at which the stock prices tend to find resistance when they are rising, and the uptrend may take a pause due to profit booking or selling interest.
Stop-loss: In general, it is a level to protect further losses in case of any unfavourable movement in the stock prices.
Past performance is not a reliable indicator of future performance.

 Please wait processing your request...