Section 1: Introduction

Section 2: Company Overview
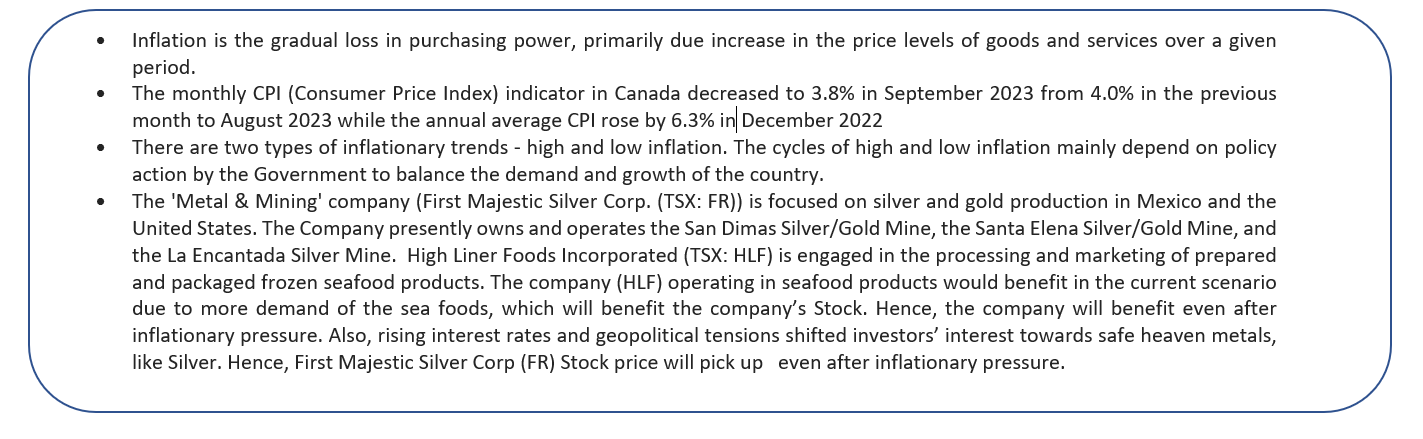
First Majestic Silver Corp (TSX: FR) is a publicly traded mining company focused on silver and gold production in Mexico and the United States. The Company presently owns and operates the San Dimas Silver/Gold Mine, the Santa Elena Silver/Gold Mine and the La Encantada Silver Mine.
Kalkine’s Inflation Report covers the Investment Highlights, Key Financial Metrics, Risks, Technical Analysis along with the Valuation, Target Price, and Recommendation on the stock.
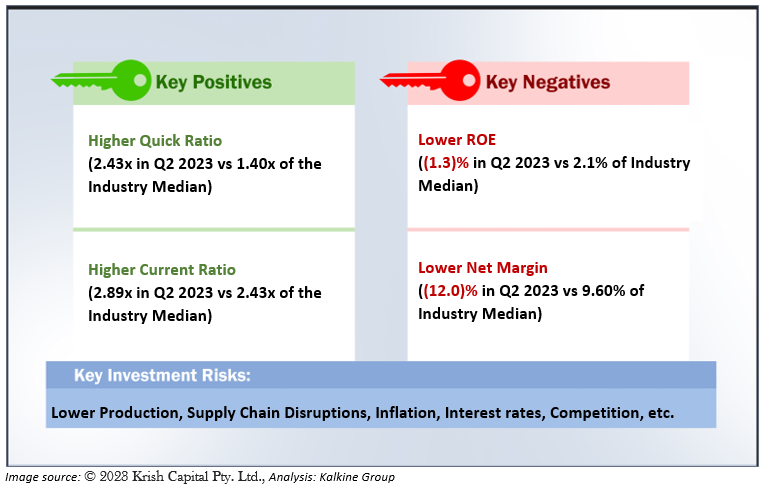
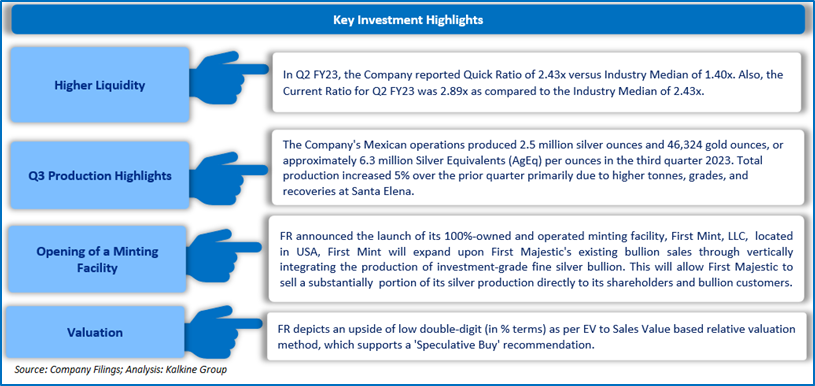
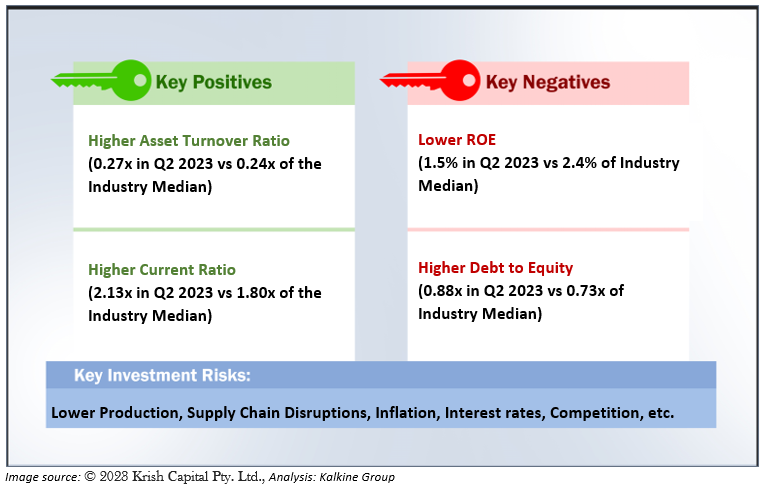
2.1 The Key Positives, Negatives, Investment Highlights, and Risks
Section3: Financial Highlights
3.1 Key Financial Highlights
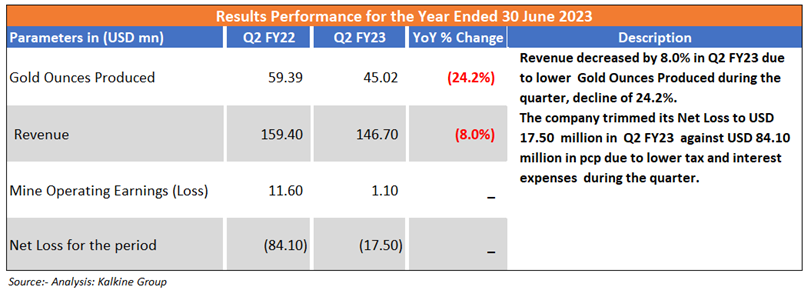
Section 4: Key Metrics
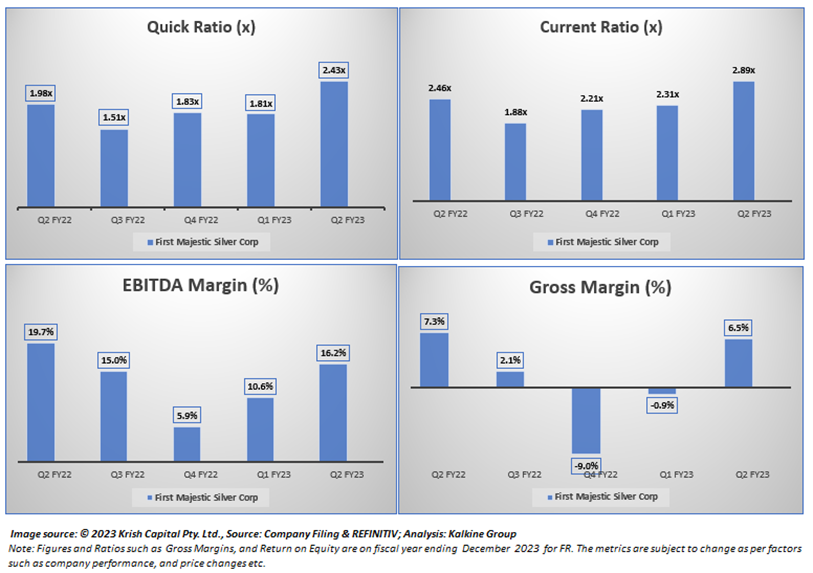
The company has successfully improved its Gross Margin and EBITDA Margin in the current quarter. Also, the company is maintaining healthy liquidity ratios, i.e., Current Ratio and Quick ratio improved in the current quarter. Below charts depict the change in EBITDA Margins, Gross Margins and Current Ratio for the firm in the one past year.
Section 5: Stock Recommendation Summary
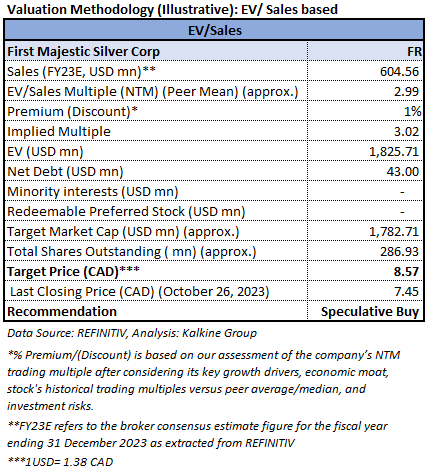
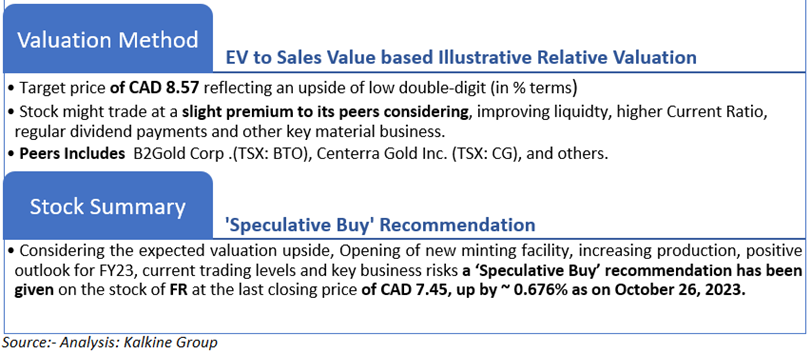
5.1 Valuation Methodology Illustrative EV to Sales Based
5.2 Price Performance and Stock Recommendation

The stock has witnessed an upside of ~13.39% in 1 month and a downside of ~10.56% over the last 3 months. Moreover, the stock is trading below the average of 52-week high price of CAD 13.04 and 52-week low price of CAD 6.51 providing an opportunity to ride the trend. First Majestic Silver Corp. (TSX: FR) was last covered on 15th September 2023.
5.3 One-Year Technical Price Chart
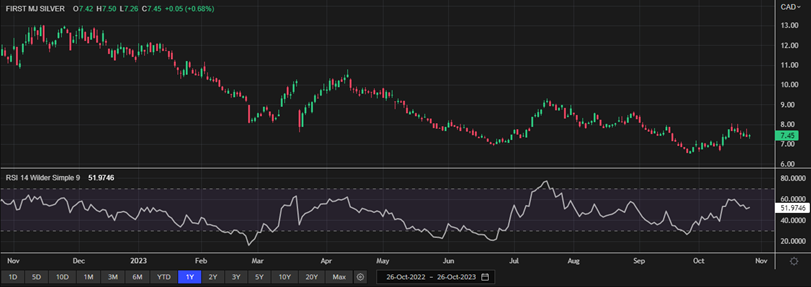
One-Year Technical Price Chart (as of October 26, 2023). Source: REFINITIV, Analysis: Kalkine Group
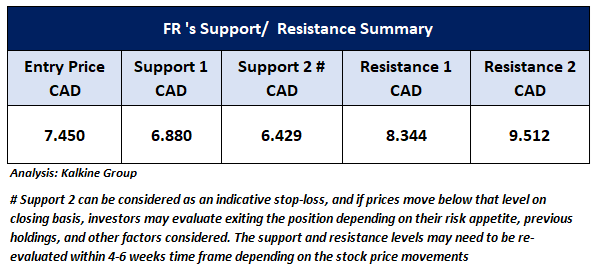
5.4 Technical Summary
Note 1: Past performance is not a reliable indicator of future performance.
Note 2: The reference date for all price data, currency, technical indicators, support, and resistance levels is October 26, 2023. The reference data in this report has been partly sourced from REFINITIV.
Note 3: Investment decisions should be made depending on an individual's appetite for upside potential, risks, holding duration, and any previous holdings. An 'Exit' from the stock can be considered if the Target Price mentioned as per the Valuation and or the technical levels provided has been achieved and is subject to the factors discussed above.
Technical Indicators Defined: -
Support: A level at which the stock prices tend to find support if they are falling, and a downtrend may take a pause backed by demand or buying interest.
Resistance: A level at which the stock prices tend to find resistance when they are rising, and the uptrend may take a pause due to profit booking or selling interest.
Stop-loss: In general, it is a level to protect further losses in case of any unfavourable movement in the stock prices.
High Liner Foods Inc
Section 1: Company Overview
High Liner Foods Inc (TSX: HLF) is a Canadian company which is mainly engaged in the processing and marketing of prepared and packaged frozen seafood products. The company sells its products to institutions, health care facilities, and quick-service family and casual dining establishments. Its foodservice brands include High Liner Culinary, Mirabel, FPI, Viking, American Pride, High Liner, Fisher Boy, Sea Cuisine and others. Kalkine’s Inflation Report covers the Investment Highlights, Key Financial Metrics, Risks, Technical Analysis along with the Valuation, Target Price, and Recommendation on the stock.
1.1 The Key Positives, Negatives, Investment Highlights, and Risks
Section2: Financial Highlights
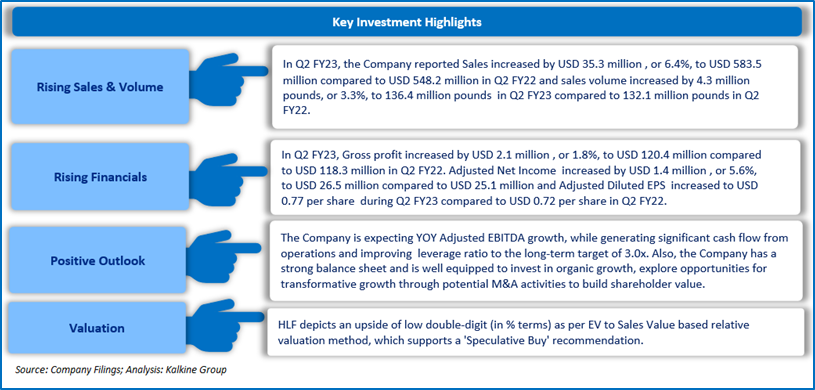
2.1 Key Financial Highlights
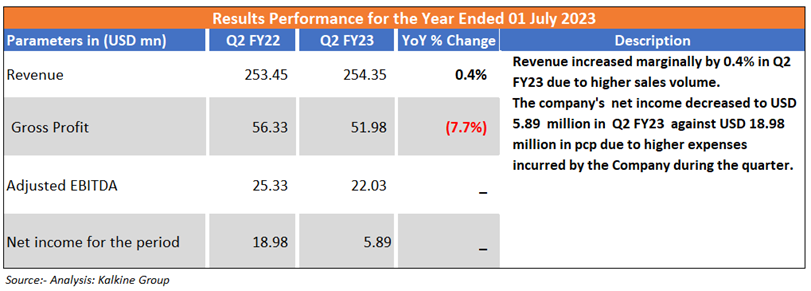
Section 3: Key Metrics
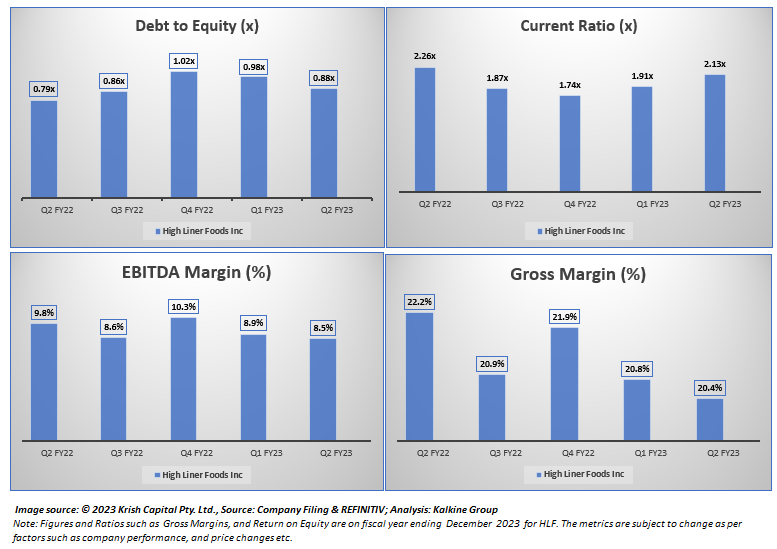
Below charts depict the change in Debt to Equity, Current Ratio and Gross margins ratios of the Company for the last one year.
Section 4: Stock Recommendation Summary
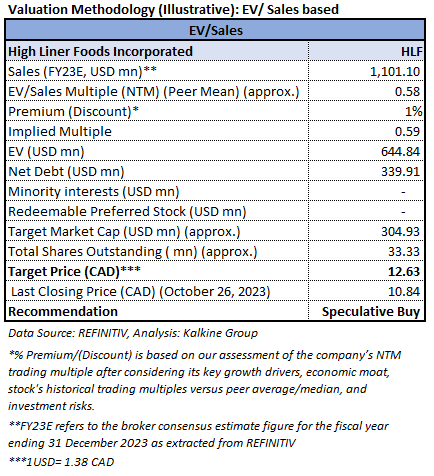
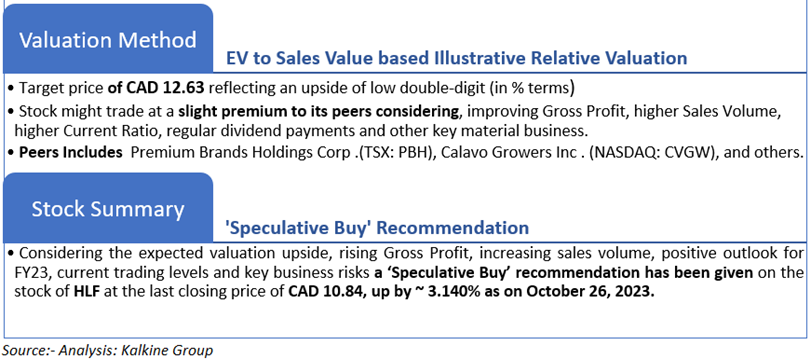
4.1 Valuation Methodology Illustrative EV to Sales Based
4.2 Price Performance and Stock Recommendation

The stock has witnessed a downside of ~1.81% in 1 month and a downside of ~23.33% over the last 3 months. Moreover, the stock is trading below the average of 52-week high price of CAD 15.87 and 52-week low price of CAD 10.41 providing an opportunity to ride the trend.
4.3 One-Year Technical Price Chart
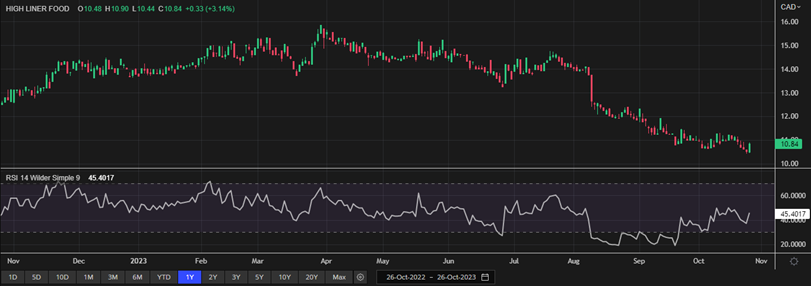
One-Year Technical Price Chart (as of October 26, 2023). Source: REFINITIV, Analysis: Kalkine Group
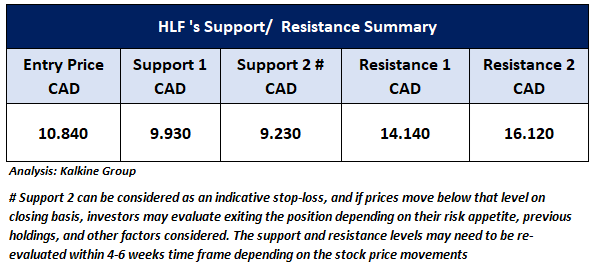
4.4 Technical Summary
Note 1: Past performance is not a reliable indicator of future performance.
Note 2: The reference date for all price data, currency, technical indicators, support, and resistance levels is October 26, 2023. The reference data in this report has been partly sourced from REFINITIV.
Note 3: Investment decisions should be made depending on an individual's appetite for upside potential, risks, holding duration, and any previous holdings. An 'Exit' from the stock can be considered if the Target Price mentioned as per the Valuation and or the technical levels provided has been achieved and is subject to the factors discussed above.
Technical Indicators Defined: -
Support: A level at which the stock prices tend to find support if they are falling, and a downtrend may take a pause backed by demand or buying interest.
Resistance: A level at which the stock prices tend to find resistance when they are rising, and the uptrend may take a pause due to profit booking or selling interest.
Stop-loss: In general, it is a level to protect further losses in case of any unfavourable movement in the stock prices.
Disclaimer
The advice given by Kalkine Canada Advisory Services Inc. and provided on this website is general information only and it does not take into account your investment objectives, financial situation and the particular needs of any particular person. You should therefore consider whether the advice is appropriate to your investment objectives, financial situation and needs before acting upon it. You should seek advice from a financial adviser, stockbroker or other professional (including taxation and legal advice) as necessary before acting on any advice. Not all investments are appropriate for all people. The website www.kalkine.ca is published by Kalkine Canada Advisory Services Inc. The link to our Terms & Conditions has been provided please go through them. On the date of publishing this report (mentioned on the website), employees and/or associates of Kalkine do not hold positions in any of the stocks covered on the website. These stocks can change any time and readers of the reports should not consider these stocks as advice or recommendations later.
Past performance is not a reliable indicator of future performance.

 Please wait processing your request...