Section 1: Introduction
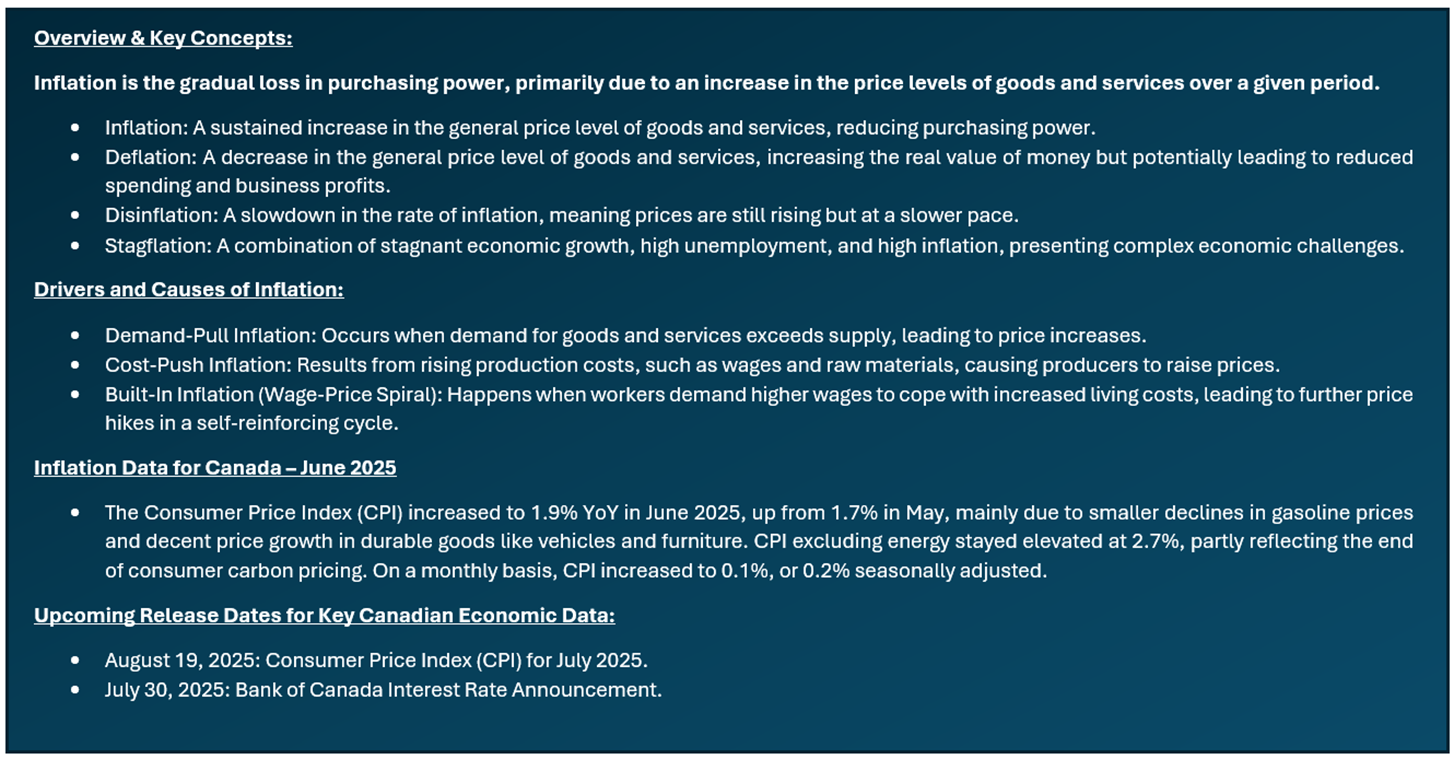
Inflation Report Coverage:
- Inflation report highlights how inflation impacts sectors differently, favoring value and defensive sectors like Energy, Materials, Consumer Staples, Healthcare, Utilities, select Financials, and REITs with inflation-indexed leases, while rate-sensitive sectors like Consumer Discretionary and high-growth Tech typically underperform.
- The report focuses on companies with proven business models, steady financials, high free cash flow, and solid ROE that can pass on costs to customers and protect margins. The aim is to identify stocks that can outperform inflation via capital gains and dividends, supporting diversified sectoral exposure.
Stocks Covered:
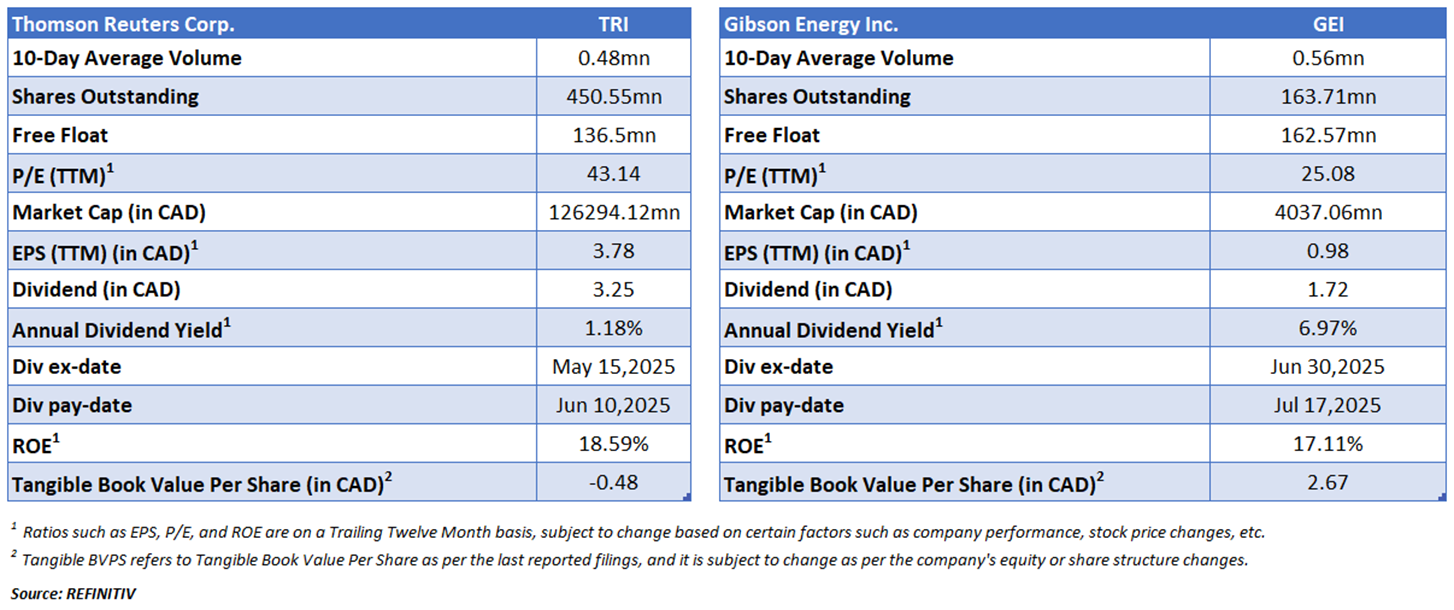
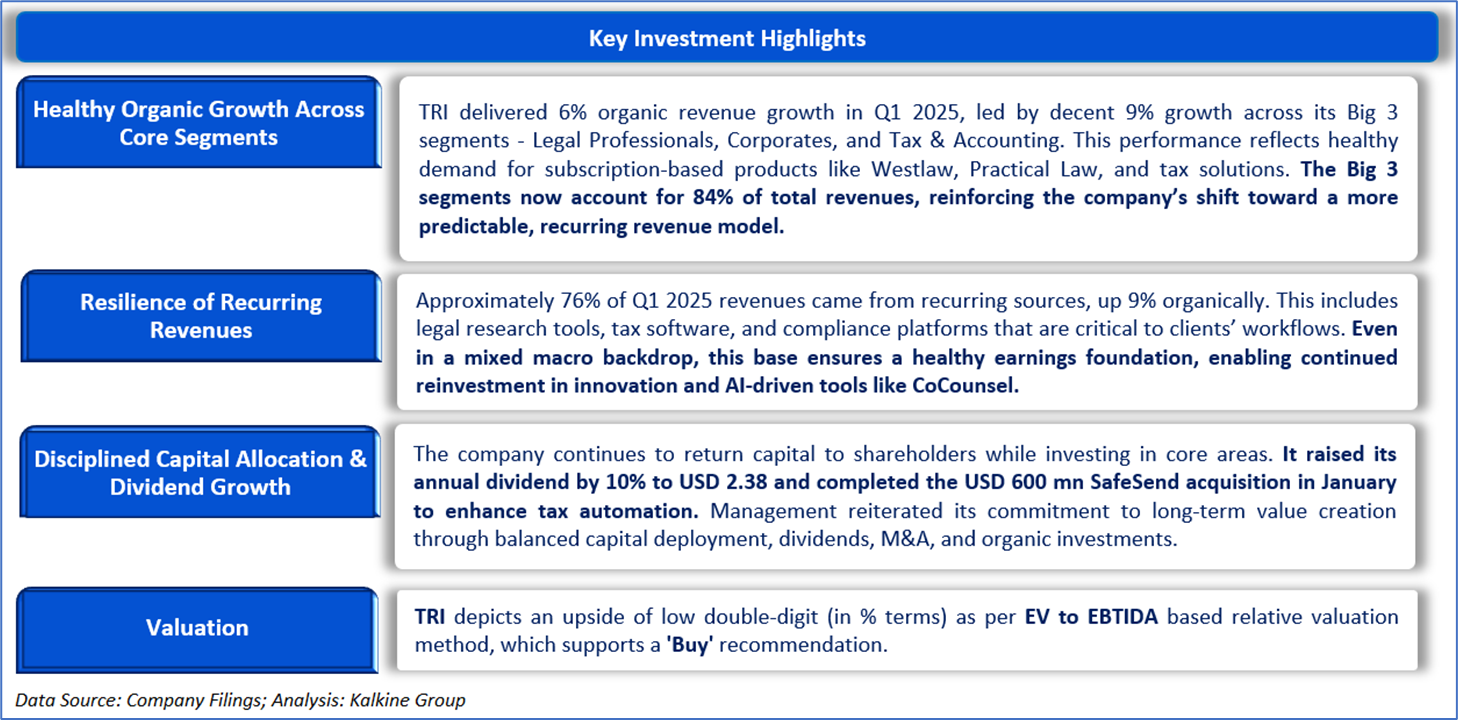
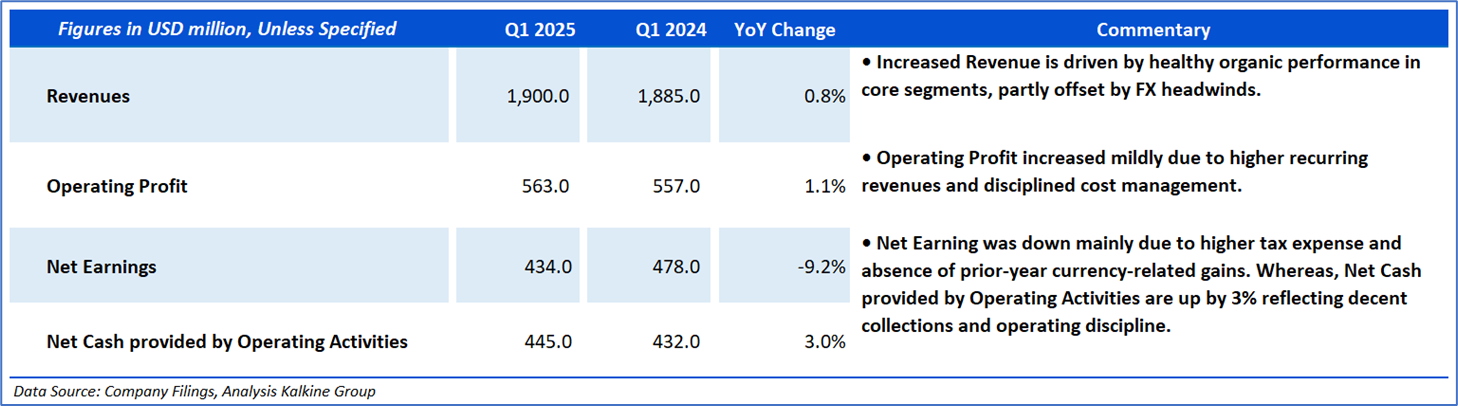
- Thomson Reuters Corp. (TSX: TRI) is well-positioned in an uncertain economic environment, backed by decent organic growth in its core legal, corporate, and tax segments. Its high recurring revenue base, disciplined cost structure, and strategic acquisitions like SafeSend support steady earnings and margin stability. The company continues to generate decent free cash flow, enabling regular dividend increases and share buybacks. With its focus on AI-driven innovation, a simplified portfolio, and healthy customer retention, TRI offers a stable, cash-generative profile with long-term growth upside.
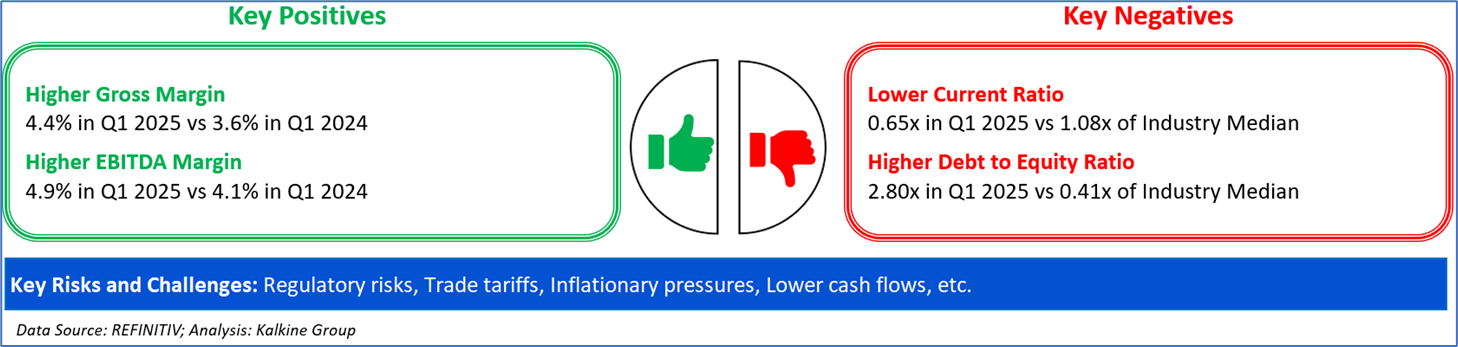
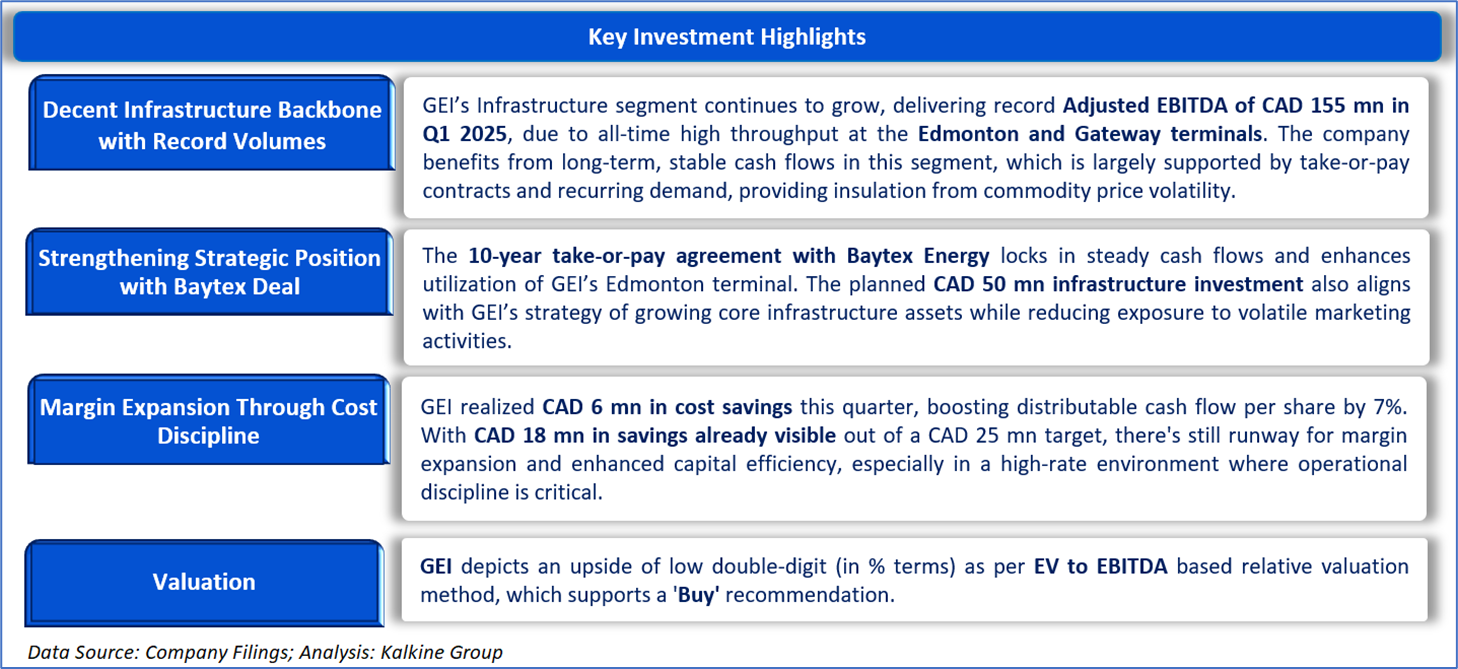
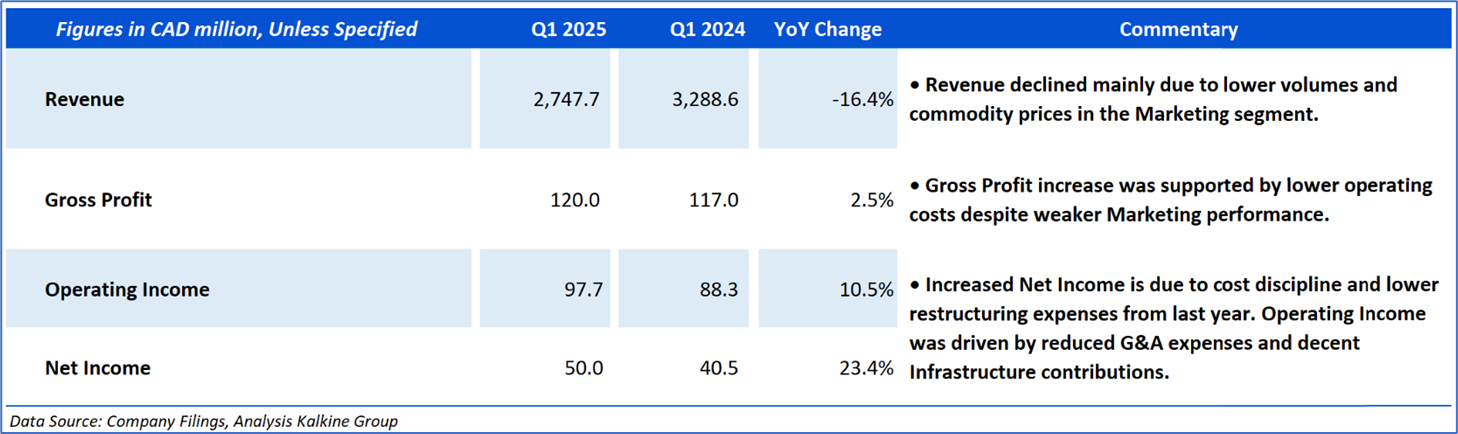
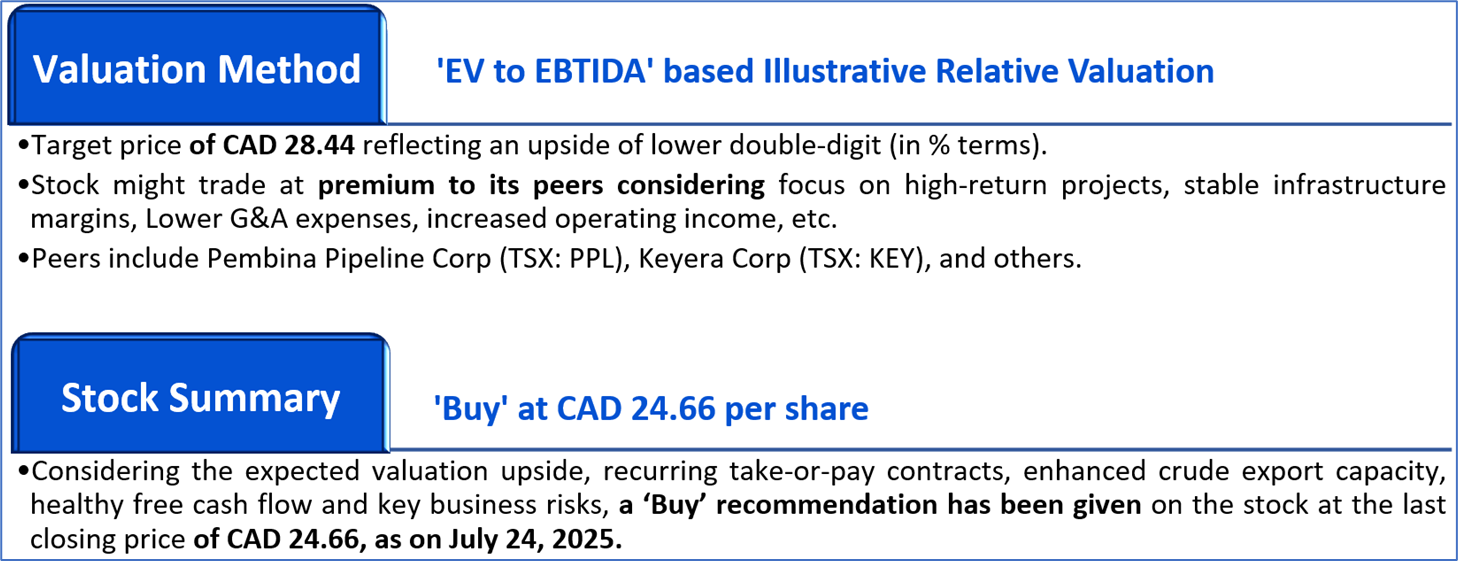
- Gibson Energy Inc. (TSX: GEI) stands out as a stable infrastructure-focused midstream player, anchored by record volumes at its Edmonton and Gateway terminals. Despite the weakness in its Marketing segment, the company continues to deliver decent Infrastructure EBITDA, supported by long-term take-or-pay contracts and disciplined cost control. Recent cost savings and a strategic partnership with Baytex add visibility to future cash flows, while capital projects like the Gateway dredging upgrade enhance export capacity. With a secure dividend, healthy operating cash flow, and a renewed leadership team, GEI offers a resilient income-generating profile with long-term infrastructure upside.
Section 2: Company Overview
Thomson Reuters Corp. (TSX: TRI) is a Canadian multinational content-driven technology conglomerate, formed in 2008 through the $17.6 billion merger of Canada's Thomson Corporation and the UK's Reuters Group. Headquartered in Toronto, the company is publicly traded on the Toronto Stock Exchange and Nasdaq under the symbol TRI and is majority-owned by The Woodbridge Company, the investment arm of the Thomson family.
Kalkine’s Inflation Report covers the Investment Highlights, Key Financial Metrics, Risks, Technical Analysis along with the Valuation, Target Price, and Recommendation on the stock.

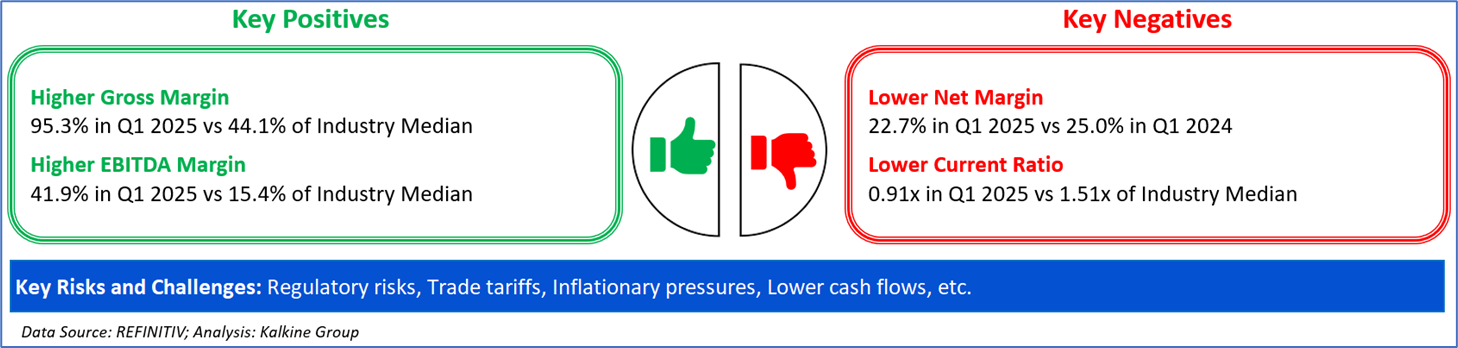
Section3: Financial Highlights

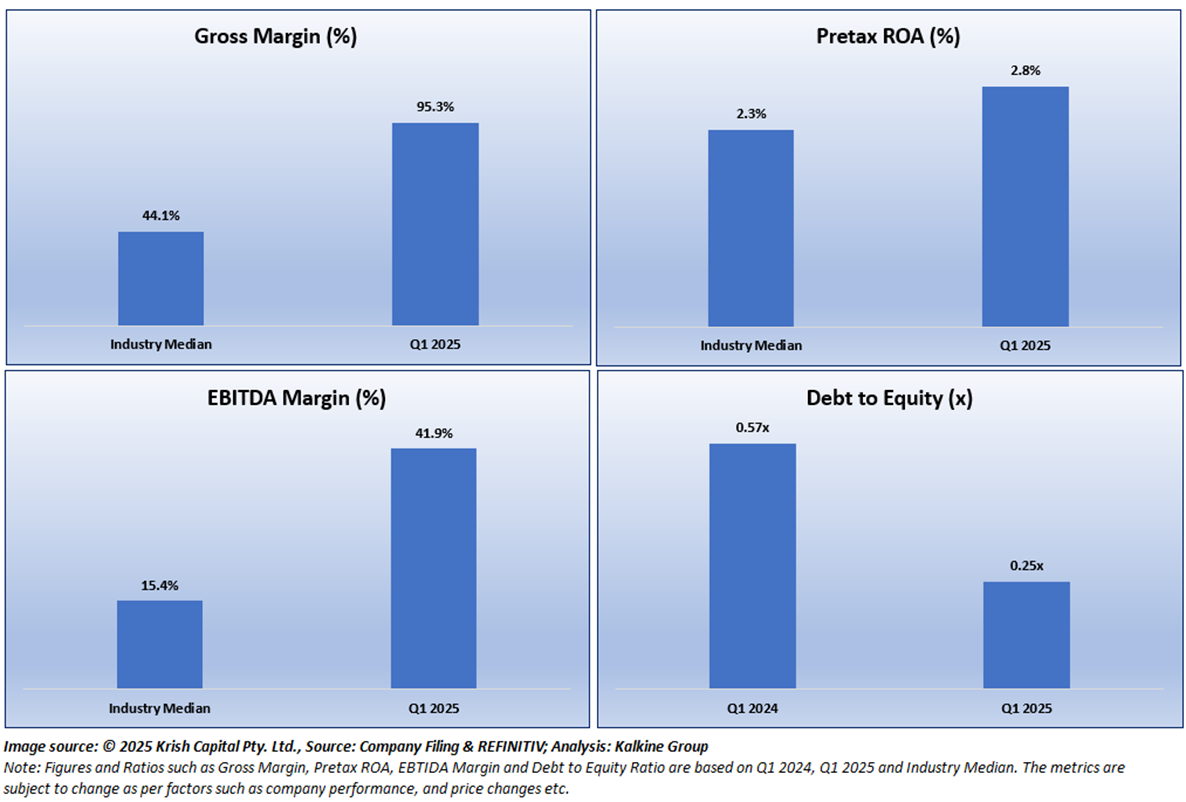
Section 4: Key Metrics
Below chart depicts the change in Gross Margin, Pretax ROA, EBTIDA Margin and Debt to Equity Ratio of the Company for Q1 2024, Q1 2025, and Industry Median.
Section 5: Stock Recommendation Summary

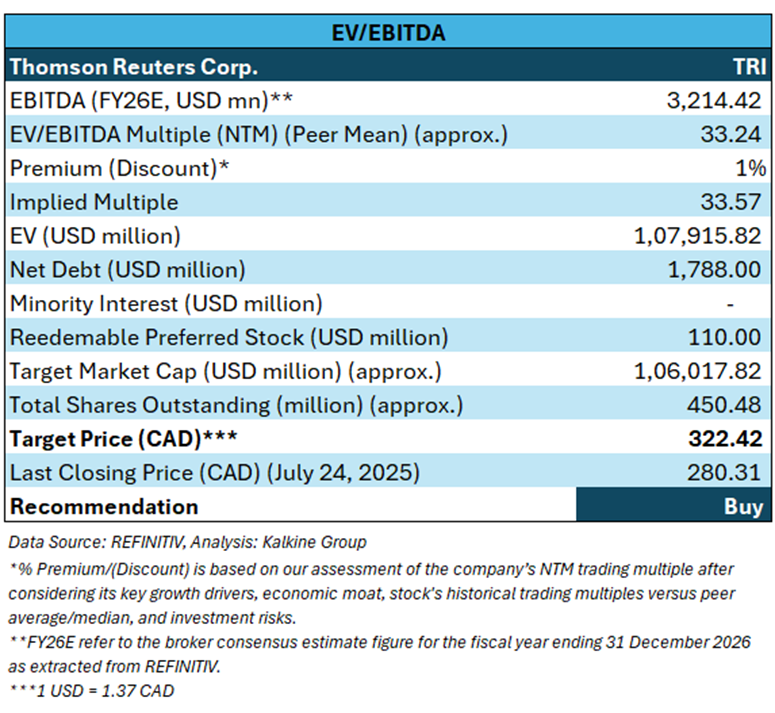
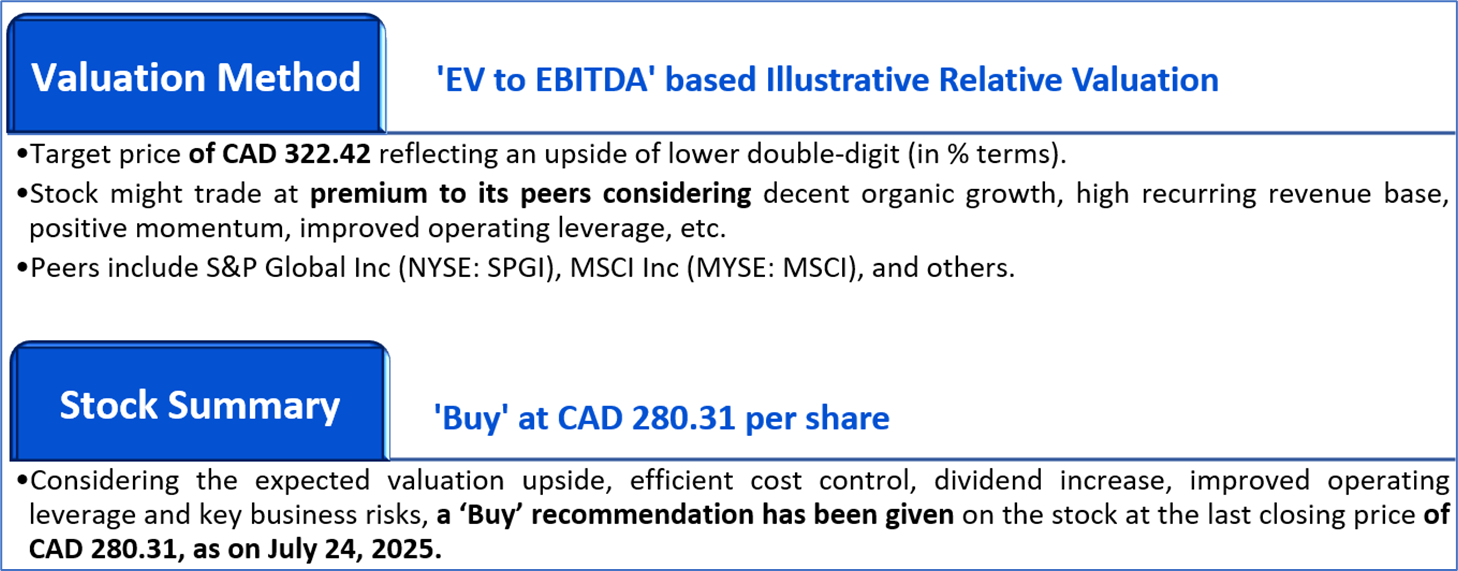
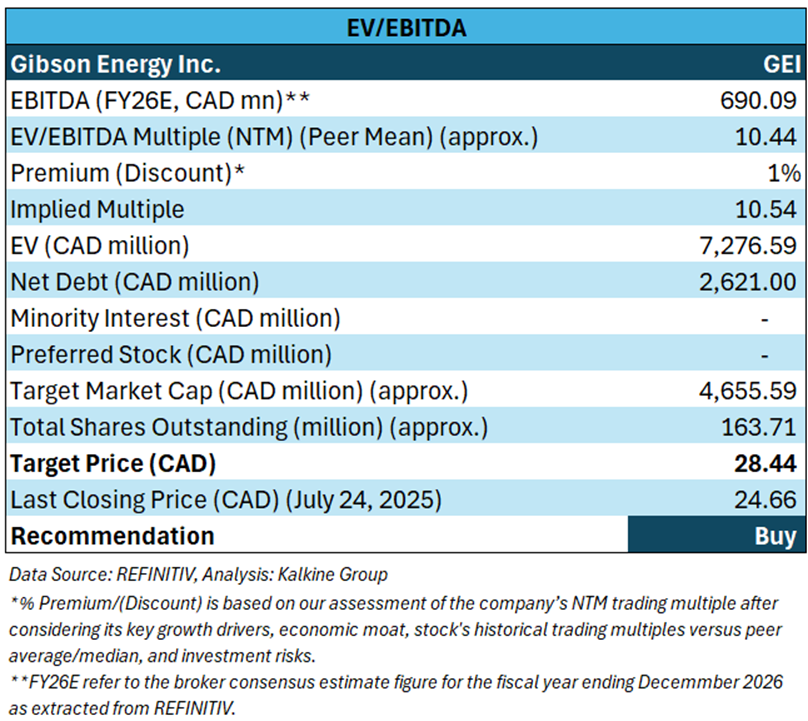
Valuation Methodology: EV to EBITDA Based Relative Valuation (Illustrative):


The stock has witnessed a downside of ~2.55% and an upside of ~11.11% over the last 1 week and 3 months respectively. Moreover, it is trading above the average 52-week high price of CAD 299.24 and 52-week low price of CAD 214.51, providing an opportunity to ride the trend.

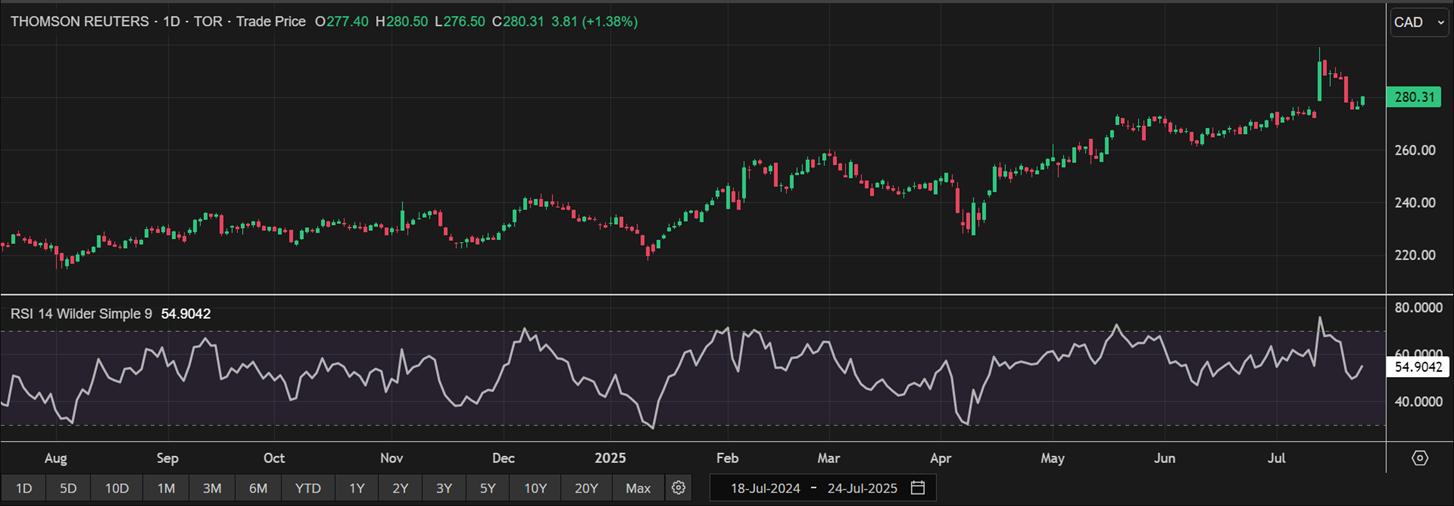
One-Year Technical Price Chart (as of July 24, 2025). Source: REFINITIV, Analysis: Kalkine Group

Section 2: Company Overview
Gibson Energy Inc. (TSX: GEI) is an oil infrastructure company that collects, stores, and processes crude oil and refined products. Reportable segments include marketing, which deals with buying, selling, and optimizing products such as crude oil, natural gas liquid, road asphalt, and oil-based mud product; and infrastructure, which makes up a system of oil terminals, rail loading facilities, pipelines, and an oil processing facility. Gibson Energy Inc. services Canada and the United States, and the majority of revenue comes from the marketing segment.
Kalkine’s Inflation Report covers the Investment Highlights, Key Financial Metrics, Risks, Technical Analysis along with the Valuation, Target Price, and Recommendation on the stock.

Section3: Financial Highlights

Section 4: Key Metrics
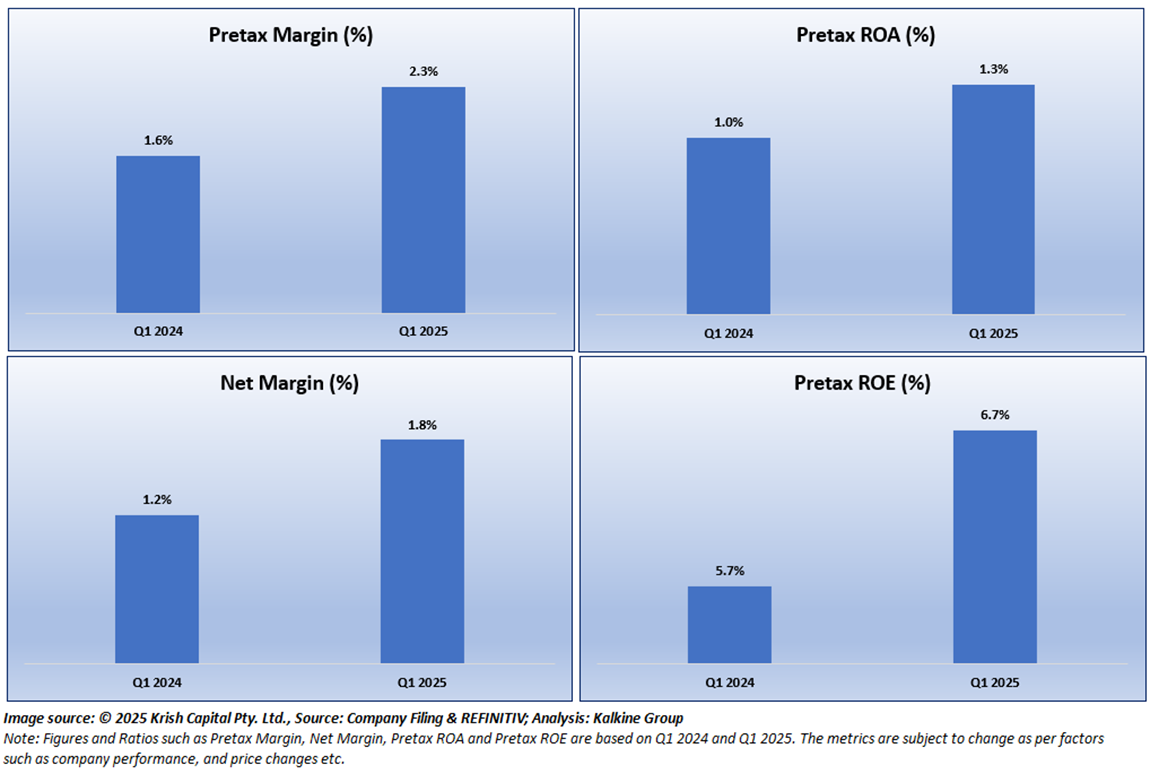
Below chart depicts the change in Pretax Margin, Net Margin, Pretax ROA and Pretax ROE are based on Q1 2024 and Q1 2025.
Section 5: Stock Recommendation Summary

Valuation Methodology: EV to EBITDA Based Relative Valuation (Illustrative):


The stock has witnessed an upside of ~0.16% and ~12.70% over the last 1 week and 3 months respectively. Moreover, it is trading above the average 52-week high price of CAD 26.10 and 52-week low price of CAD 19.63, providing an opportunity to ride the trend.

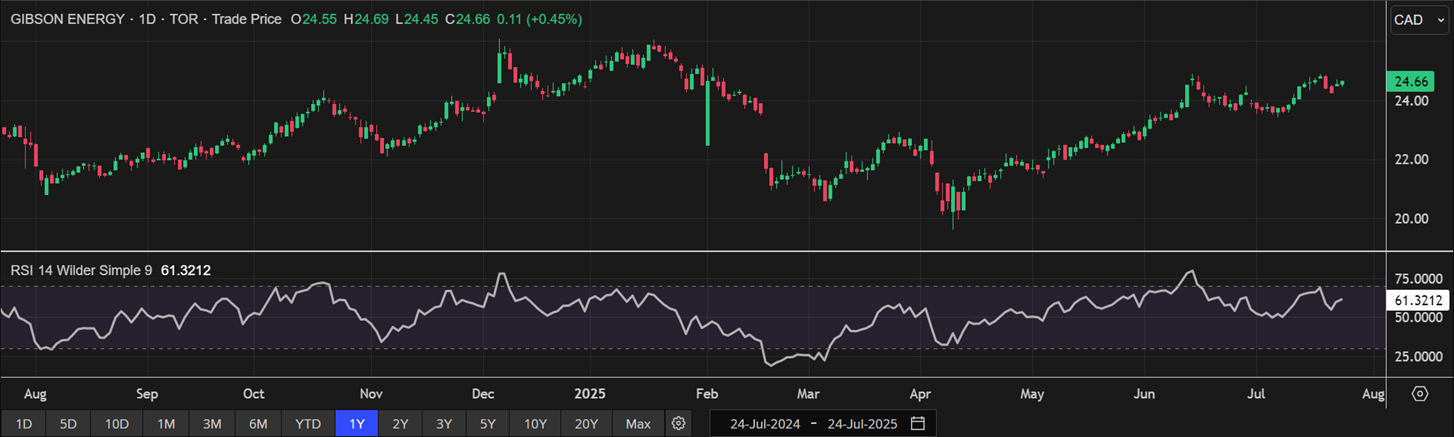
One-Year Technical Price Chart (as of July 24, 2025). Source: REFINITIV, Analysis: Kalkine Group

Note 1: Past performance is not a reliable indicator of future performance.
Note 2: The reference date for all price data, currency, technical indicators, support, and resistance levels is July 24, 2025. The reference data in this report has been partly sourced from REFINITIV.
Note 3: Investment decisions should be made depending on an individual's appetite for upside potential, risks, holding duration, and any previous holdings. An 'Exit' from the stock can be considered if the Target Price mentioned as per the Valuation and or the technical levels provided has been achieved and is subject to the factors discussed above.
Note 4: Dividend Yield may vary as per the stock price movement.
Note 5: Kalkine reports are prepared based on the stock prices captured either from REFINITIV or Trading View. Typically, REFINITIV or Trading View may reflect stock prices with a delay which could be a lag of 25-30 minutes. There can be no assurance that future results or events will be consistent with the information provided in the report. The information is subject to change without any prior notice.
Technical Indicators Defined: -
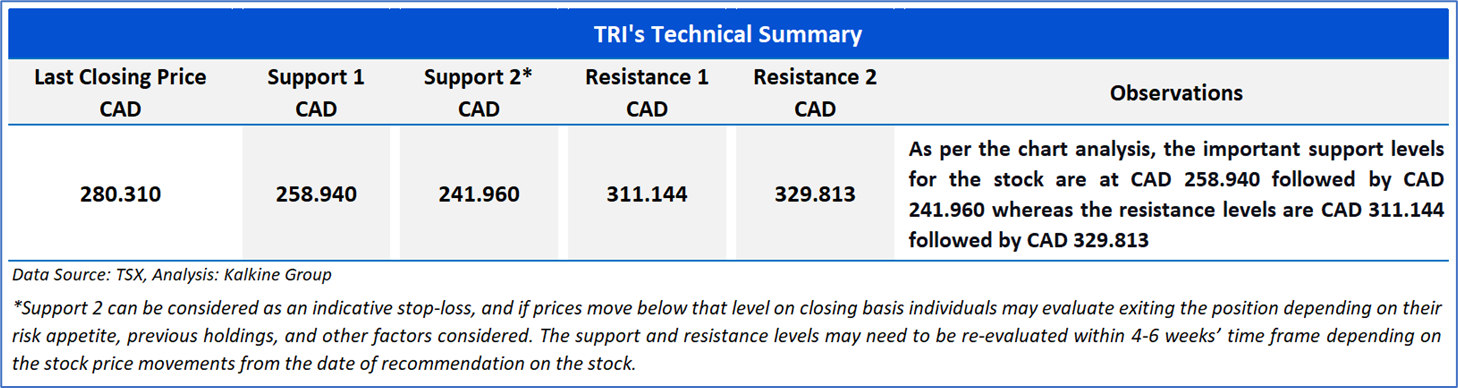
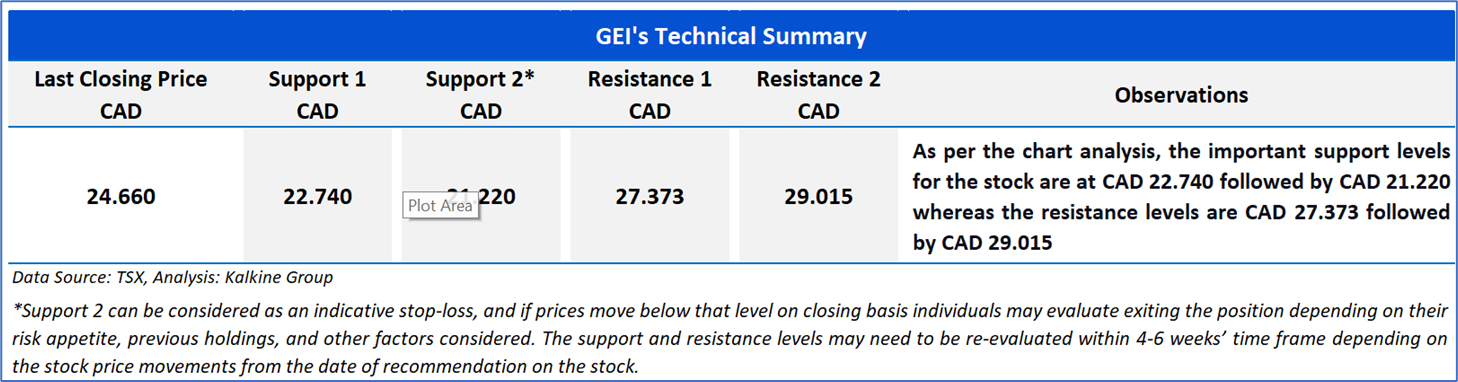
Support: A level at which the stock prices tend to find support if they are falling, and a downtrend may take a pause backed by demand or buying interest.
Resistance: A level at which the stock prices tend to find resistance when they are rising, and the uptrend may take a pause due to profit booking or selling interest.
Stop-loss: In general, it is a level to protect further losses in case of any unfavourable movement in the stock prices.
Past performance is not a reliable indicator of future performance.

 Please wait processing your request...