Overview
This week’s report covers Tradr 2X Short NBIS Daily ETF (NBIZ), Defiance Daily Target 2X Long MP ETF (MPL) which are ‘Directional Leveraged ETFs’ that use financial derivatives and debt to amplify the returns of an underlying index, typically by 2x or 3x. These leveraged ETFs aim to provide magnified exposure to the price movements of a specific asset class, either in the direction of rising (bullish) or falling (bearish) prices.
Section 1: Tradr 2X Short NBIS Daily ETF (NBIZ)
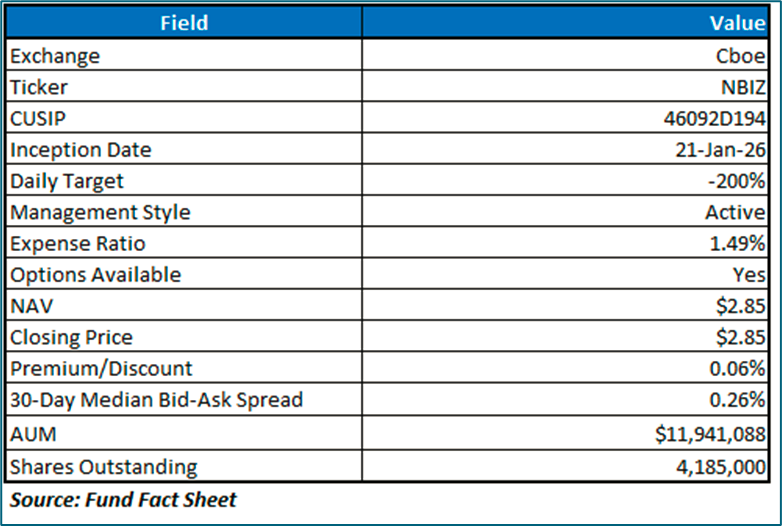
The Fund seeks daily leveraged investment results of two times (200%) the daily percentage change in the share price of Nebius Group NV (NASDAQ: NBIS). The Fund may enter into one or more swap agreements with financial institutions for a specified period, which may range from one day to longer than a year.
Its performance over extended periods diverges from the expected 200% due to the compounding effect of daily returns, which is influenced by factors like holding duration and stock volatility. High volatility amplifies the impact of compounding, potentially leading to significant deviations from the underlying stock’s performance. Consequently, this ETF is designed for short-term trading rather than buy-and-hold strategies.
Underlying Stock: Nebius Group (NASDAQ: NBIS)
Nebius Group NV (NASDAQ: NBIS) is a Netherlands-based infrastructure company operating in the technology industry. The Company is engaged in developing a portfolio of artificial intelligence-related technology assets. It is involved in creating an artificial intelligence-centric player to integrate the essential elements of artificial intelligence development with infrastructure, data and advisory globally. It offers products and services such as a cloud platform for artificial intelligence-related workloads, development team services for autonomous vehicles, development of generative artificial intelligence.
Section 2: Technical Analysis on ETF and Underlying Asset
CBOE: NBIZ
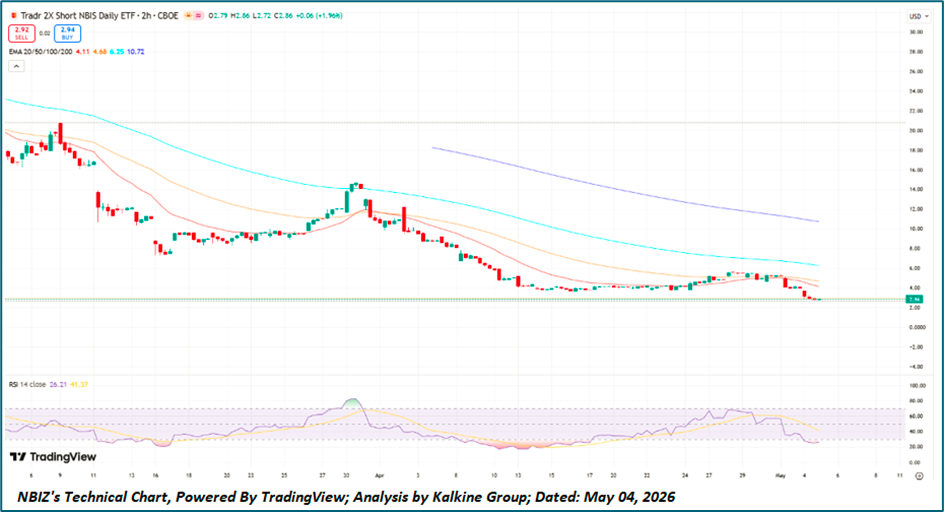
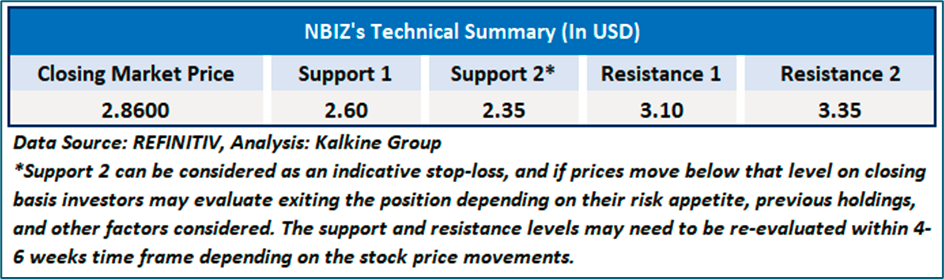
The Tradr 2X Short NBIS Daily ETF (NBIZ) is exhibiting a strong bearish continuation trend, with price consistently trading below all key exponential moving averages (20/50/100/200), indicating sustained downward momentum and structural weakness. The downward-sloping EMAs and widening separation between them reflect persistent selling pressure and lack of trend reversal signals. Momentum indicators further confirm this bias, with RSI hovering in the lower range (~30–40), suggesting weak buying interest without yet entering deeply oversold territory—leaving room for further downside. Recent price action shows a failure to sustain minor rebounds, forming lower highs and lower lows, which reinforces the prevailing downtrend. Unless the ETF reclaims the short-term EMA cluster (~USD 3.5–4.0 zone), the technical setup favors continued downside, with immediate support near the recent lows around USD 2.7–2.8 and limited evidence of accumulation.
Underlying Asset Analysis: NASDAQ: NBIS
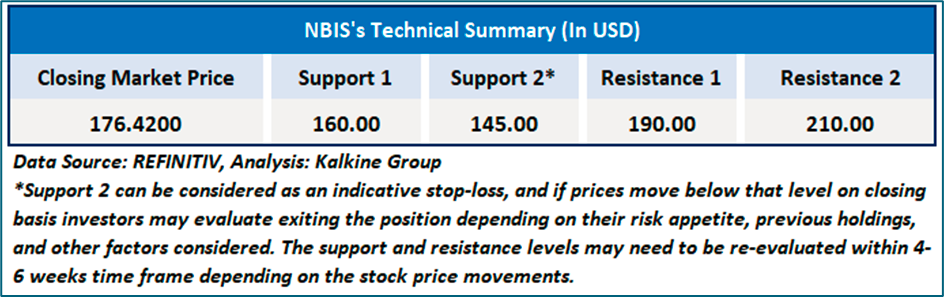
Nebius Group N.V. (NBIS) is currently exhibiting a strong bullish breakout structure, with price trending decisively above all key exponential moving averages (20/50/100/200), reflecting sustained upward momentum and trend strength. The alignment of moving averages in a bullish stack, along with their upward slope, confirms a well-established uptrend. Price has recently approached the upper resistance zone (~USD 175–180), indicating a potential breakout or consolidation phase. Momentum indicators further support this view, with RSI elevated near the 70+ range, suggesting strong buying pressure but also nearing overbought territory, which may lead to short-term consolidation. Importantly, the formation of higher highs and higher lows, coupled with strong recovery from prior pullbacks, indicates continued accumulation. A sustained move above the resistance zone could trigger further upside, while immediate support is seen near the USD 150–155 range (short-term EMA cluster).
Section 1: Defiance Daily Target 2X Long MP ETF (MPL):
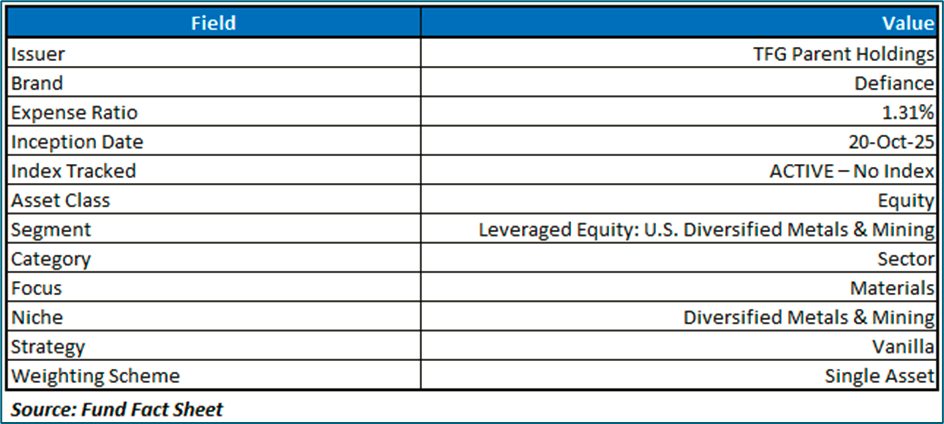
The Fund seeks daily investment results, before fees and expenses, of two times (200%) the daily percentage change in the share price of MP Materials Corporation (NYSE: MP). The Fund is an actively managed ETF that attempts to achieve two times the daily percentage change in the share price of the Underlying Security.
Its performance over extended periods diverges from the expected 200% due to the compounding effect of daily returns, which is influenced by factors like holding duration and stock volatility. High volatility amplifies the impact of compounding, potentially leading to significant deviations from the underlying stock’s performance. Consequently, this ETF is designed for short-term trading rather than buy-and-hold strategies.
Underlying Stock: MP Materials Corporation
MP Materials Corp. produces specialty materials that are vital inputs for electrification and other advanced technologies. The Company owns and operates the Mountain Pass Rare Earth Mine and Processing Facility (Mountain Pass) located in California. It is also developing a rare earth metal, alloy and magnet manufacturing facility in Fort Worth, Texas (Independence Facility). The Company’s segments include Materials and Magnetics.

Section 2: Technical Analysis on ETF and Underlying Asset
NASDAQ: MPL
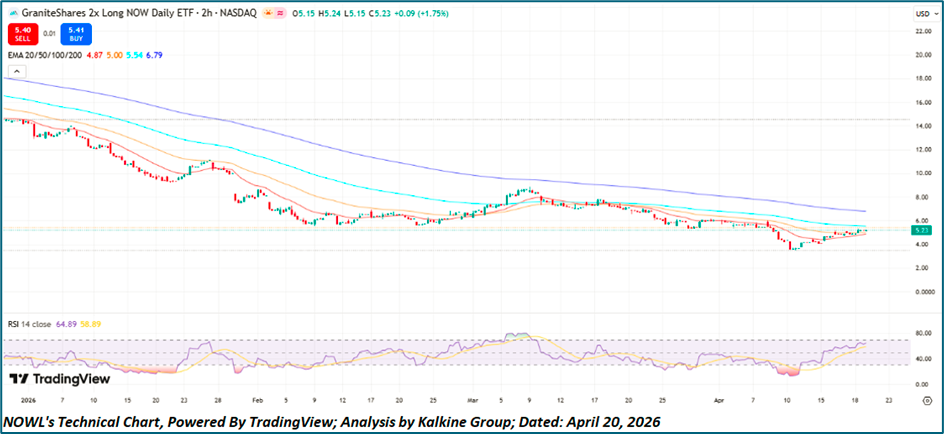
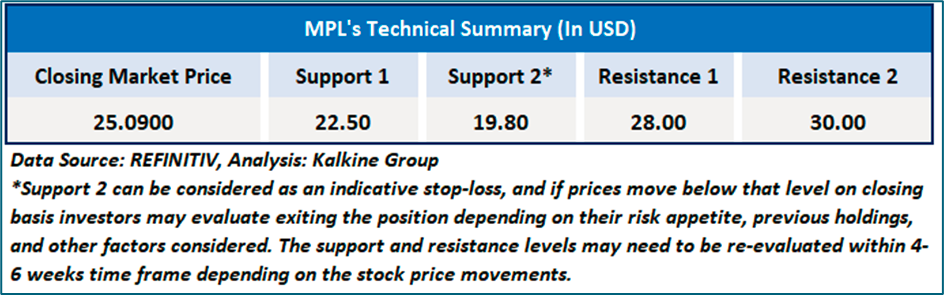
Defiance Daily Target 2X Long MP ETF (MPL) is currently exhibiting a short-term recovery within a broader range-bound structure, with price rebounding from recent lows (~USD 14–15) and attempting to stabilize above the 20-day moving average. While this indicates improving near-term sentiment, the ETF remains below key medium-term resistance around the 50-day moving average (~USD 25–26), suggesting that the broader trend is still neutral rather than decisively bullish. Momentum indicators show RSI recovering toward the mid-50s to low-60s range, reflecting strengthening buying pressure without entering overbought territory. Price action has begun forming higher lows, indicating early accumulation; however, the inability to sustain above resistance zones highlights continued supply pressure. A confirmed breakout above the USD 26 level could signal trend continuation toward prior highs, while failure to hold above the USD 22–23 support zone may lead to renewed downside.
Underlying Asset Analysis: NYSE: MP
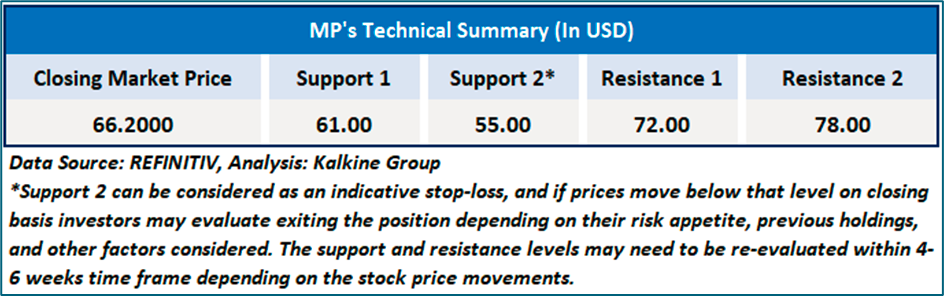
MP Materials Corp. (MP) is currently exhibiting a range-bound to gradually improving technical structure, with price recovering from recent lows (~USD 48–50) and moving above the short-term 20-day and 50-day moving averages, indicating improving near-term momentum. However, the stock continues to face resistance near the USD 68–70 zone, which has acted as a key supply area historically, limiting sustained upside. The longer-term 200-day moving average (~USD 56) is trending upward and now providing structural support, suggesting the broader trend is stabilizing. Momentum indicators show RSI around the mid-50 to 60 range, reflecting balanced bullish momentum without overextension. The formation of higher lows signals early accumulation, but confirmation of a stronger uptrend would require a decisive breakout above the USD 70 level; failure to hold above the USD 60–62 support zone could result in renewed consolidation.
|
Related Risk: Investing in the Fund carries inherent risks, including potential losses. The Fund's NAV and performance are influenced by various factors. Key risks include the effects of compounding, market volatility, and underlying stock risks, which can significantly impact returns and increase the likelihood of financial losses.
|
|
Note 1: Past performance is not a reliable indicator of future performance.
|
|
Note 2: The reference date for all price data, currency, technical indicators, support, and resistance level is May 04, 2026. The reference data in this report has been partly sourced from REFINITIV
|
|
Note 3: ‘Kalkine reports are prepared based on the stock prices captured either from the New York Stock Exchange (NYSE), NASDAQ Capital Markets (NASDAQ), and or REFINITIV. Typically, all sources (NYSE, NASDAQ, or REFINITIV) may reflect stock prices with a delay which could be a lag of 25-30 minutes. There can be no assurance that future results or events will be consistent with the information provided in the report. The information is subject to change without any prior notice.
|
Past performance is not a reliable indicator of future performance.

 NZ
 UK
 US
 AU
 IND

 CA

 Please wait processing your request...