Section 1: Introduction
Inflation Report Coverage:
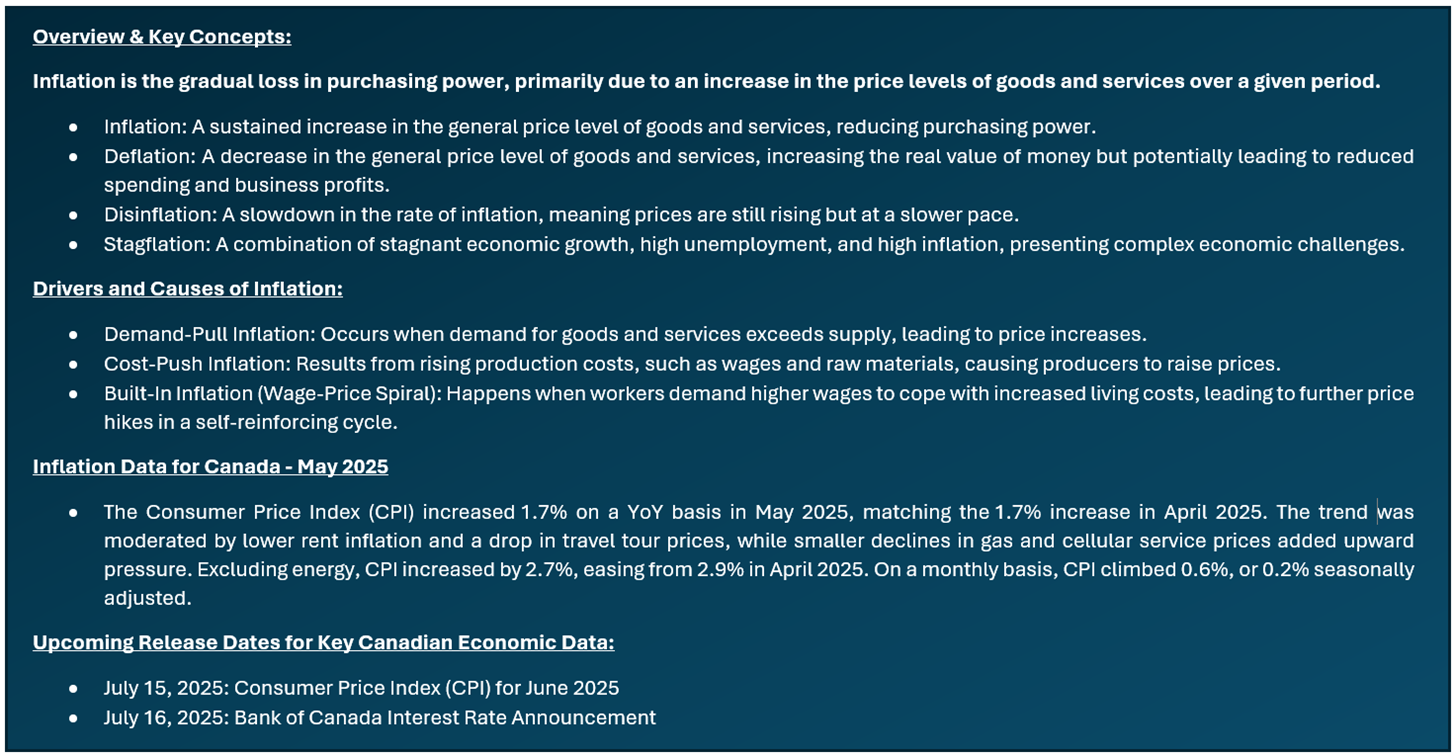
- Inflation report highlights how inflation impacts sectors differently, favoring value and defensive sectors like Energy, Materials, Consumer Staples, Healthcare, Utilities, select Financials, and REITs with inflation-indexed leases, while rate-sensitive sectors like Consumer Discretionary and high-growth Tech typically underperform.
- The report focuses on companies with proven business models, steady financials, high free cash flow, and solid ROE that can pass on costs to customers and protect margins. The aim is to identify stocks that can outperform inflation via capital gains and dividends, supporting diversified sectoral exposure.
Stocks Covered:
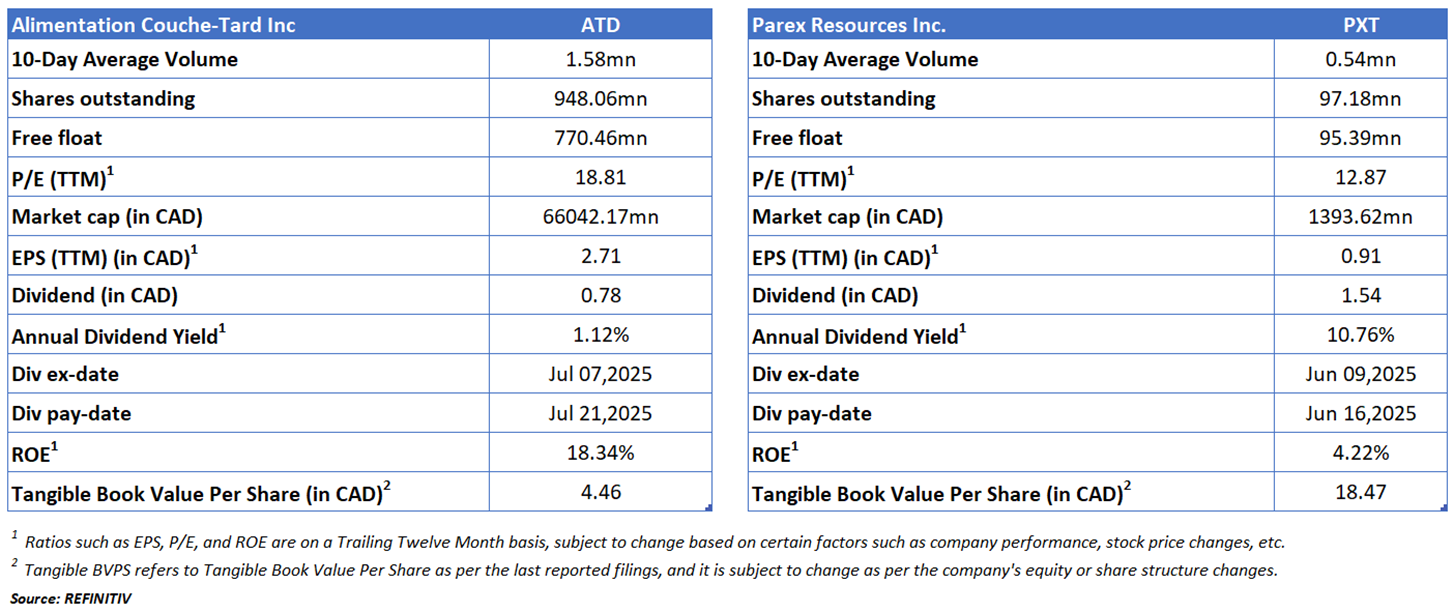
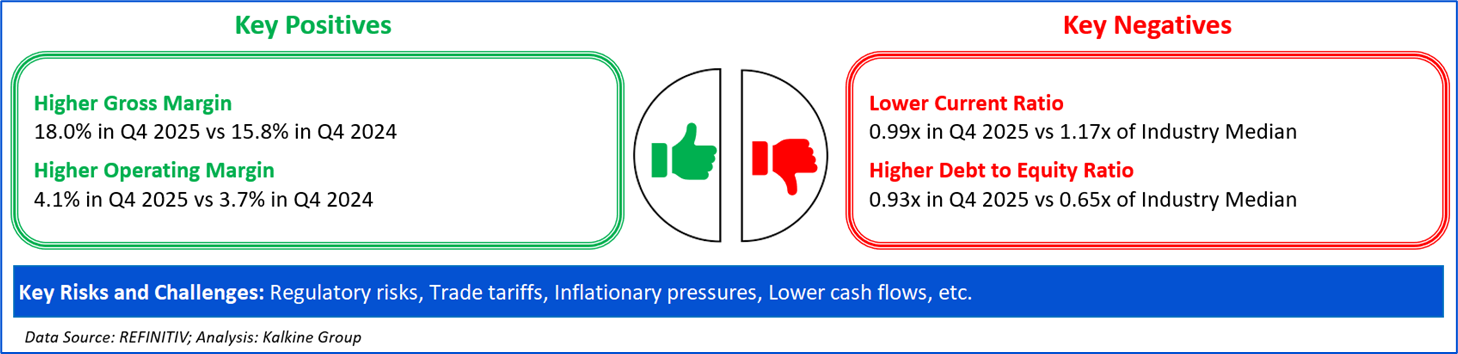
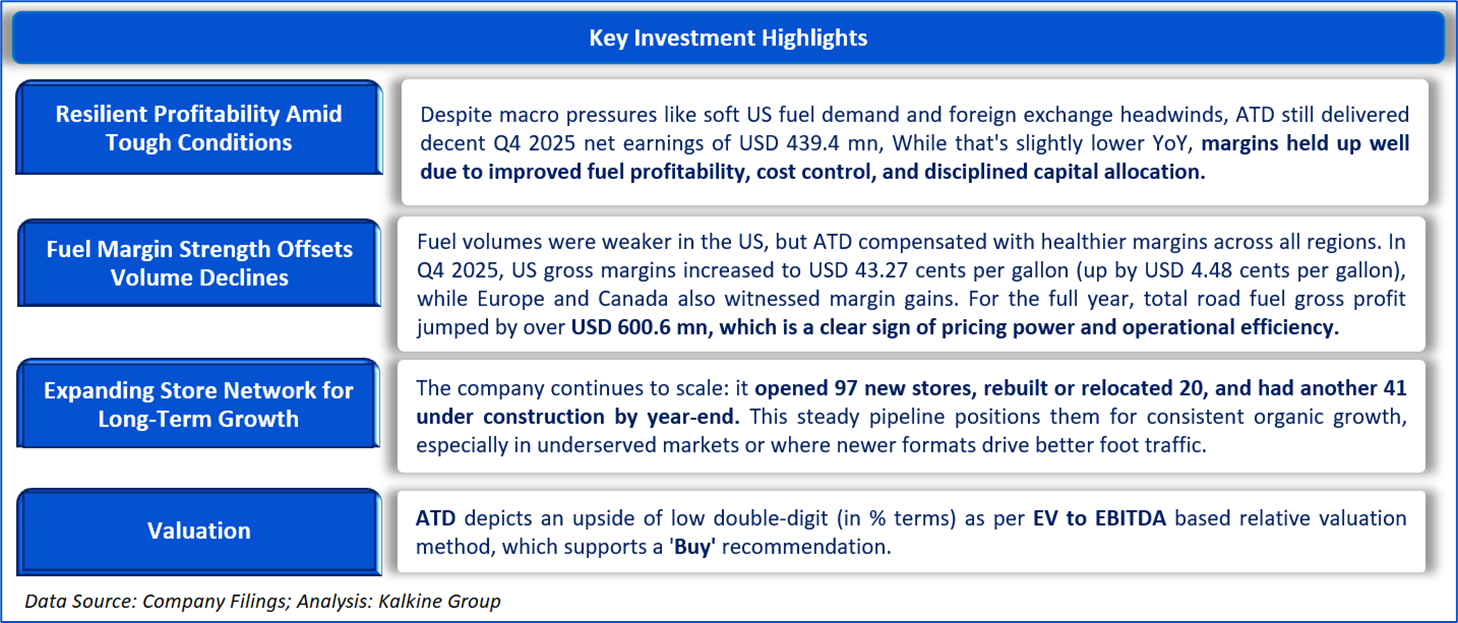
- Alimentation Couche-Tard (TSX: ATD) is well-positioned in a mixed macro environment thanks to its global scale, strong fuel margin performance, and resilient convenience retail model. The company continues to deliver stable earnings through disciplined cost control, high fuel profitability, and steady merchandise sales growth in Canada and Europe. Strategic acquisitions like TotalEnergies and an expanding store network support long-term growth, while decent free cash flow enables consistent buybacks and dividend increases. Its ability to adapt to changing consumer behavior and maintain healthy margins makes it a good defensive pick with upside potential.
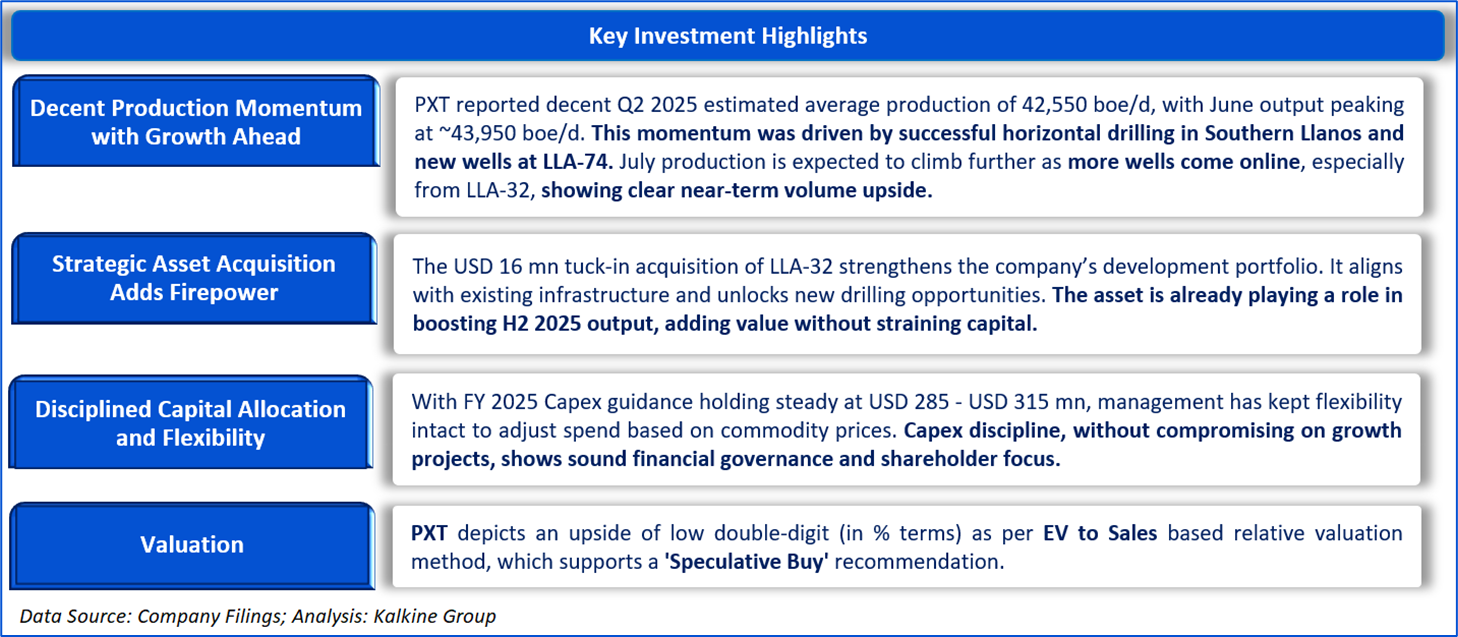
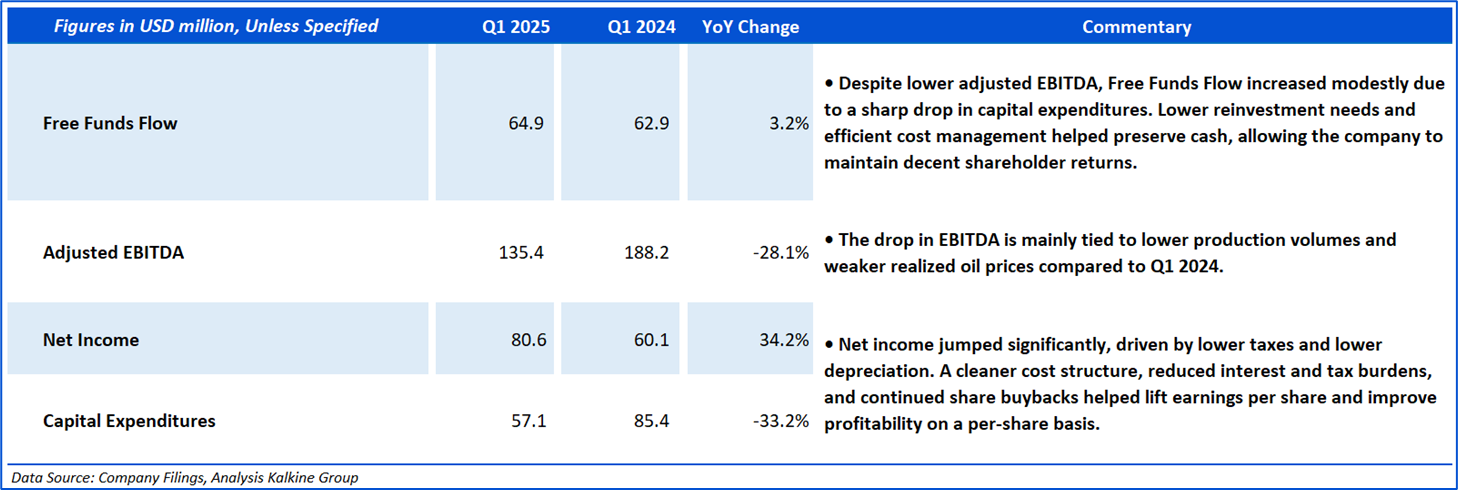
- Parex Resources (TSX: PXT) is well-positioned in a volatile oil price environment, supported by its low-cost asset base, decent free cash flow generation, and flexible capital program. Its net cash balance, minimal tax burden, and disciplined capital spending help preserve margins and support consistent dividends and buybacks. With growing production momentum, strategic expansion at LLA-32, and positive exploration results, Parex offers stable earnings and resilient cash flows even amid market uncertainty.
Section 2: Company Overview
Alimentation Couche-Tard Inc (TSX: ATD) operates a network of convenience stores across North America, Ireland, Scandinavia, Poland, the Baltics, and Russia. The company primarily generates income through the sale of tobacco products, groceries, beverages, fresh food, quick service restaurants, car wash services, other retail products and services, road transportation fuel, stationary energy, marine fuel, and chemicals. In addition, the company operates more stores under the Circle K banner in other countries such as China, Egypt, and Malaysia. Its operation is geographically divided into U.S., Europe, and Canada. Revenue from external customers fall mainly into three categories: merchandise and services, road transportation fuel, and other.
Kalkine’s Inflation Report covers the Investment Highlights, Key Financial Metrics, Risks, Technical Analysis along with the Valuation, Target Price, and Recommendation on the stock.

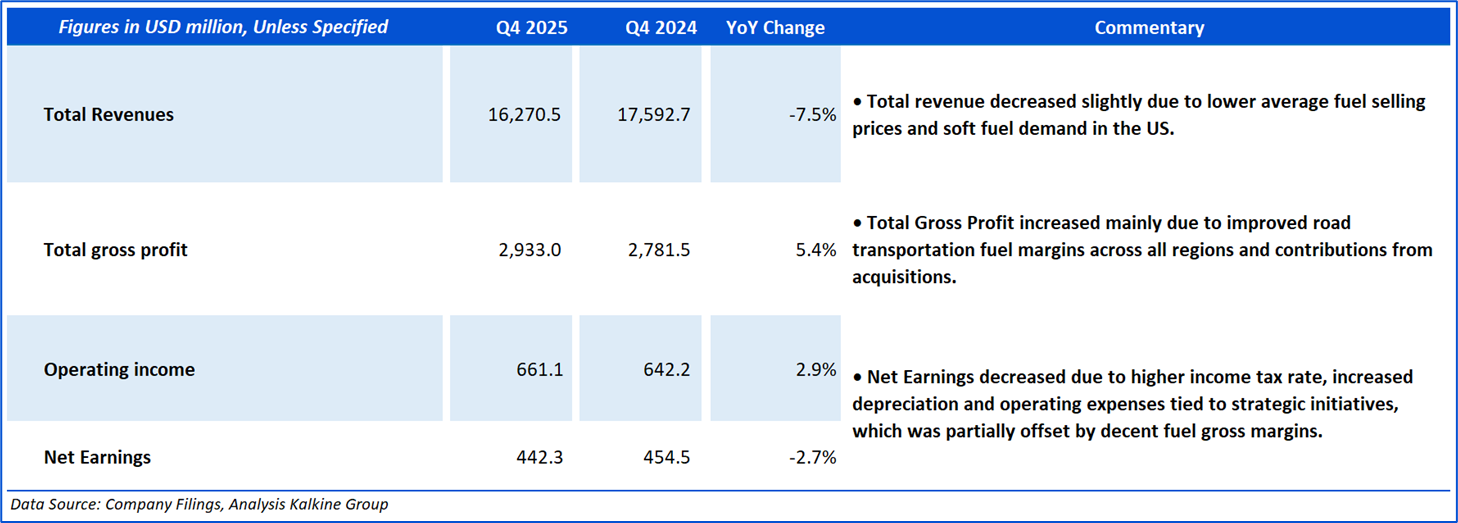
Section3: Financial Highlights

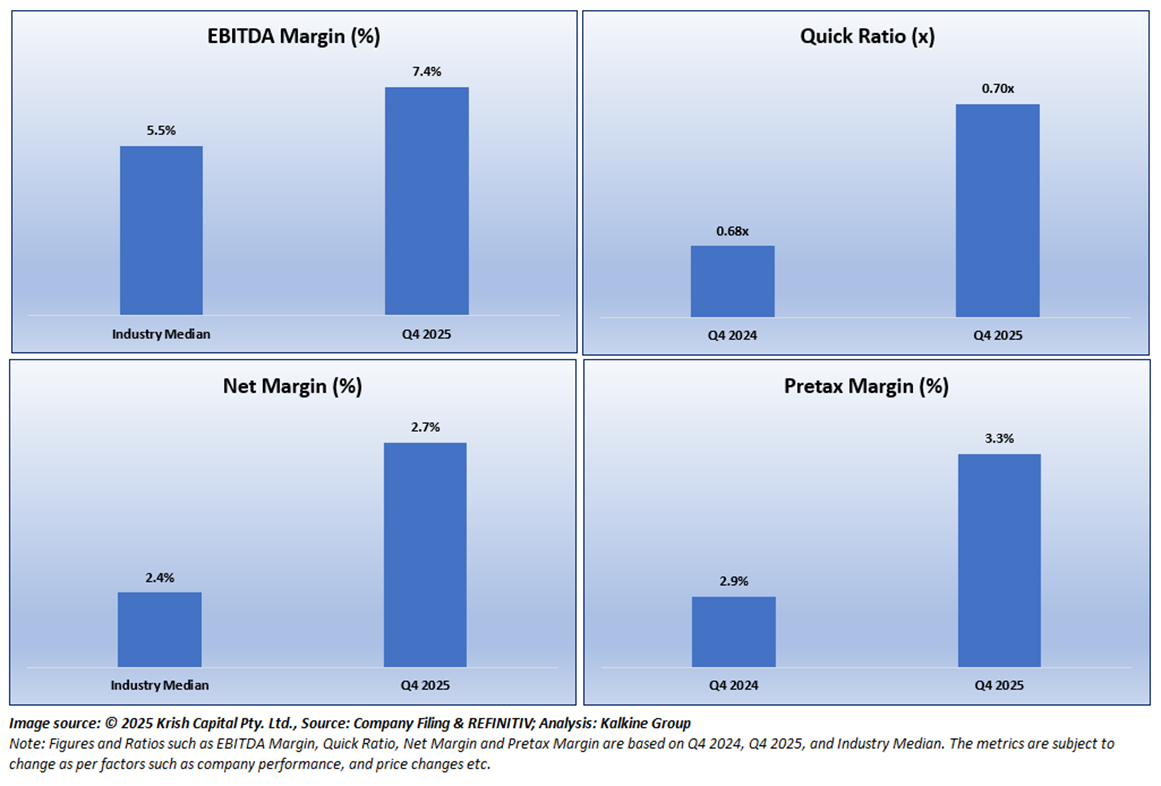
Section 4: Key Metrics
Below chart depicts the change in EBITDA Margin, Quick Ratio, Net Margin and Pretax Margin of the Company for Q4 2024, Q4 2025, and Industry Median.
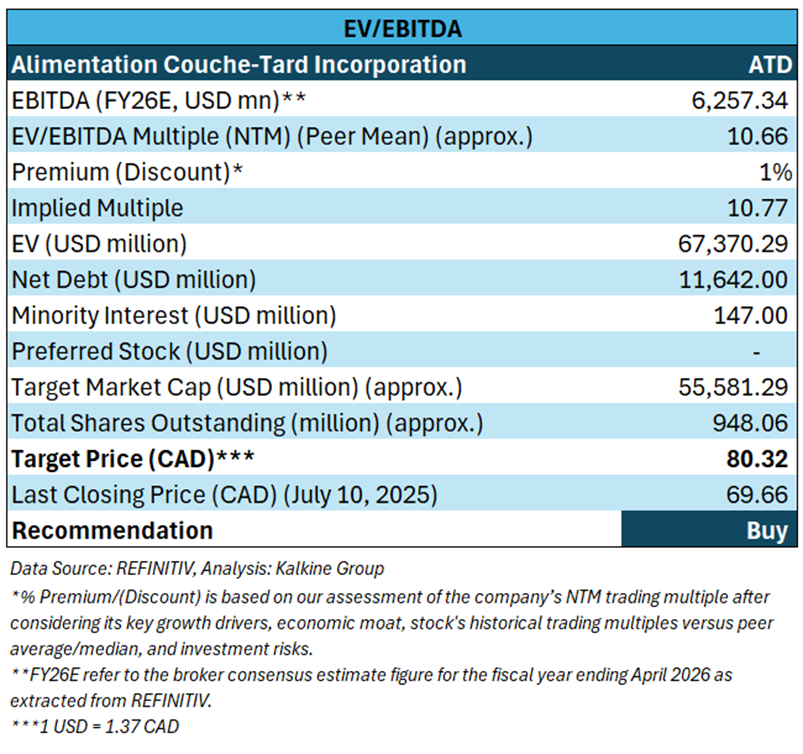
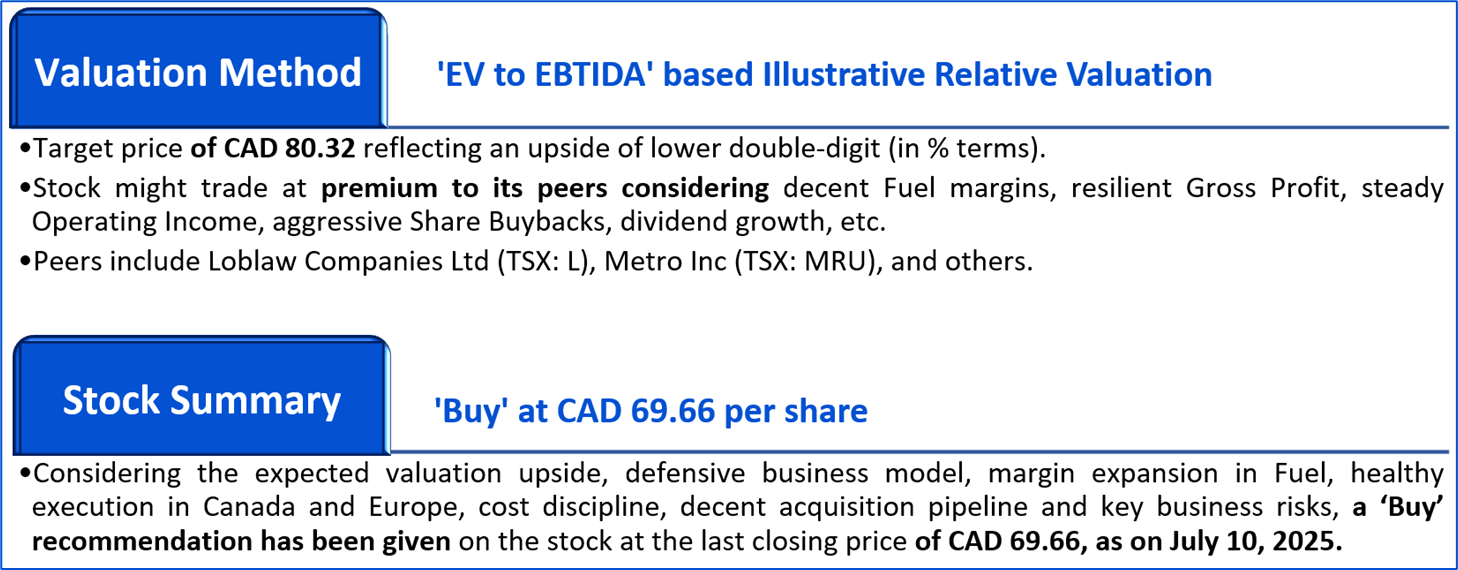
Section 5: Stock Recommendation Summary

Valuation Methodology: EV to EBITDA Based Relative Valuation (Illustrative):


The stock has witnessed an upside of ~1.01% and ~1.27% over the last 1 week and 3 months respectively. Moreover, it is trading below the average 52-week high price of CAD 85.53 and 52-week low price of CAD 65.95, providing an opportunity to accumulate the stock.

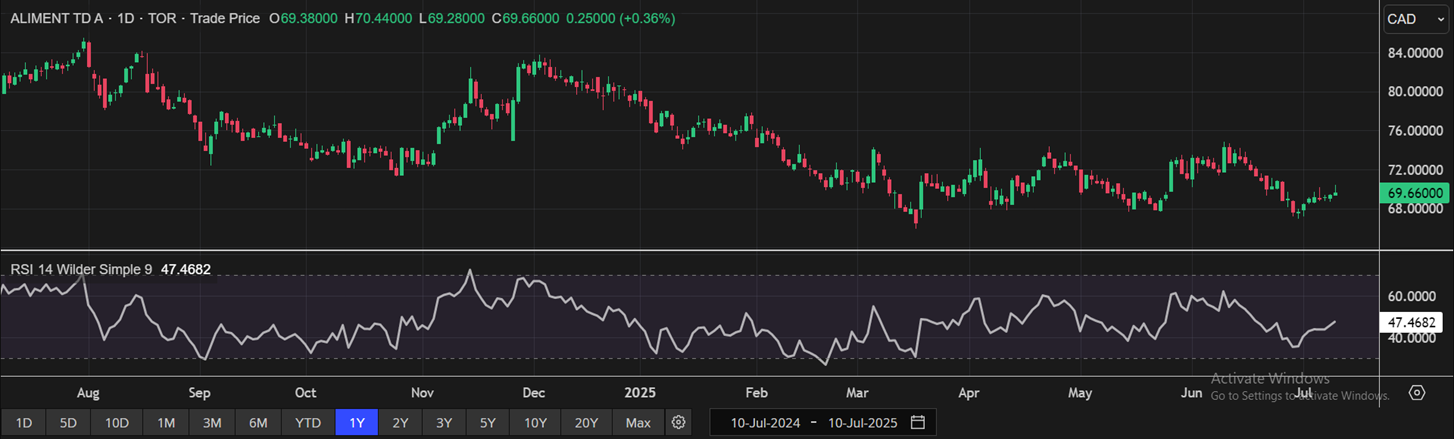
One-Year Technical Price Chart (as of July 10, 2025). Source: REFINITIV, Analysis: Kalkine Group

Section 2: Company Overview
Parex Resources Incorporation (TSX: PXT) engages in exploration, development, and production of crude oil. The company brings technology utilized in the Western Canada Sedimentary Basin to South American basins with large oil-in-place potential. Majority of the company's properties are focused in Colombia, where it pays a royalty or tax to the government for its operations. Parex depends on a team of geologists and geophysicists, in partnership with technologies such as 3D seismic surveying, to help exploration efforts. Oil production is sold to a small basket of participants in South and North America.
Kalkine’s Inflation Report covers the Investment Highlights, Key Financial Metrics, Risks, Technical Analysis along with the Valuation, Target Price, and Recommendation on the stock.

Section3: Financial Highlights

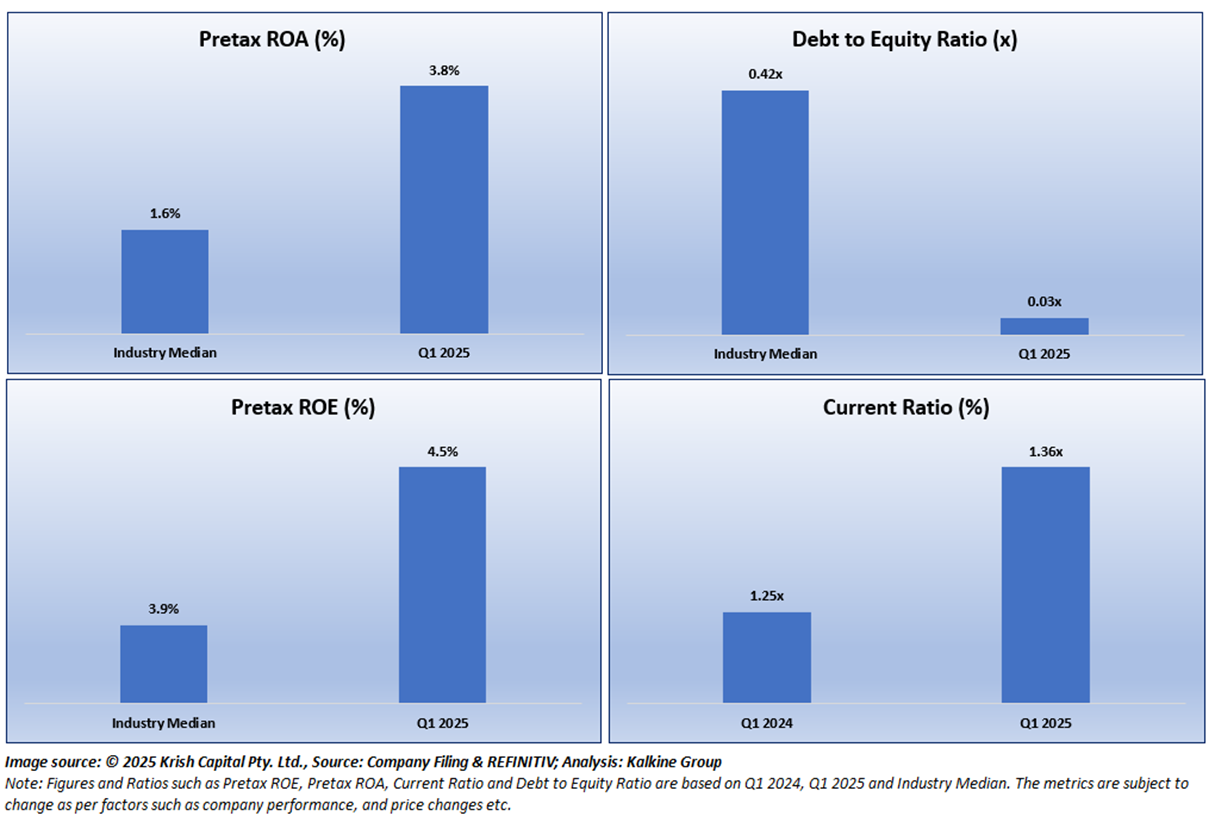
Section 4: Key Metrics
Below chart depicts the change in Pretax ROE, Pretax ROA, Debt to Equity Ratio and Current Ratio are based on Q1 2024, Q1 2025 and Industry Median.
Section 5: Stock Recommendation Summary

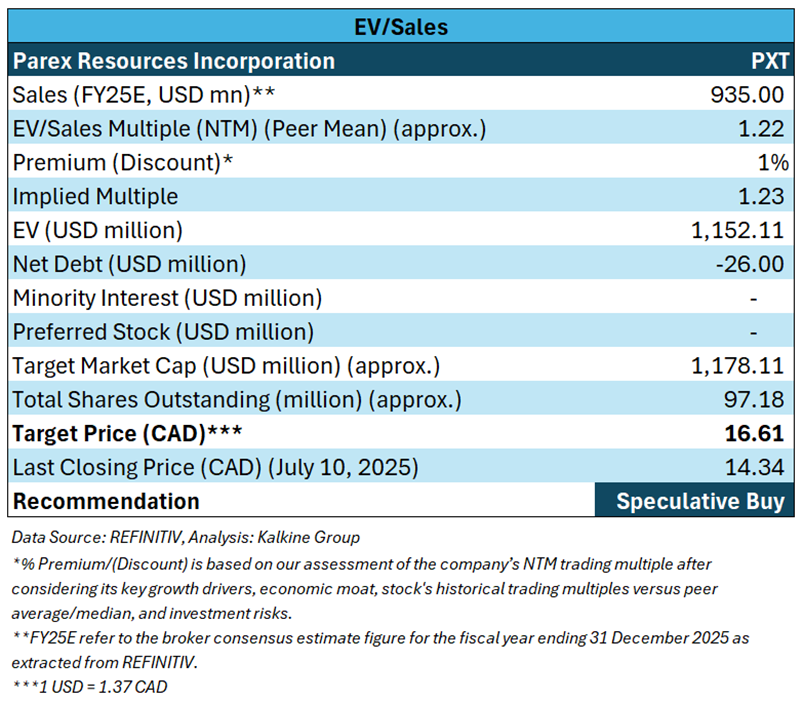
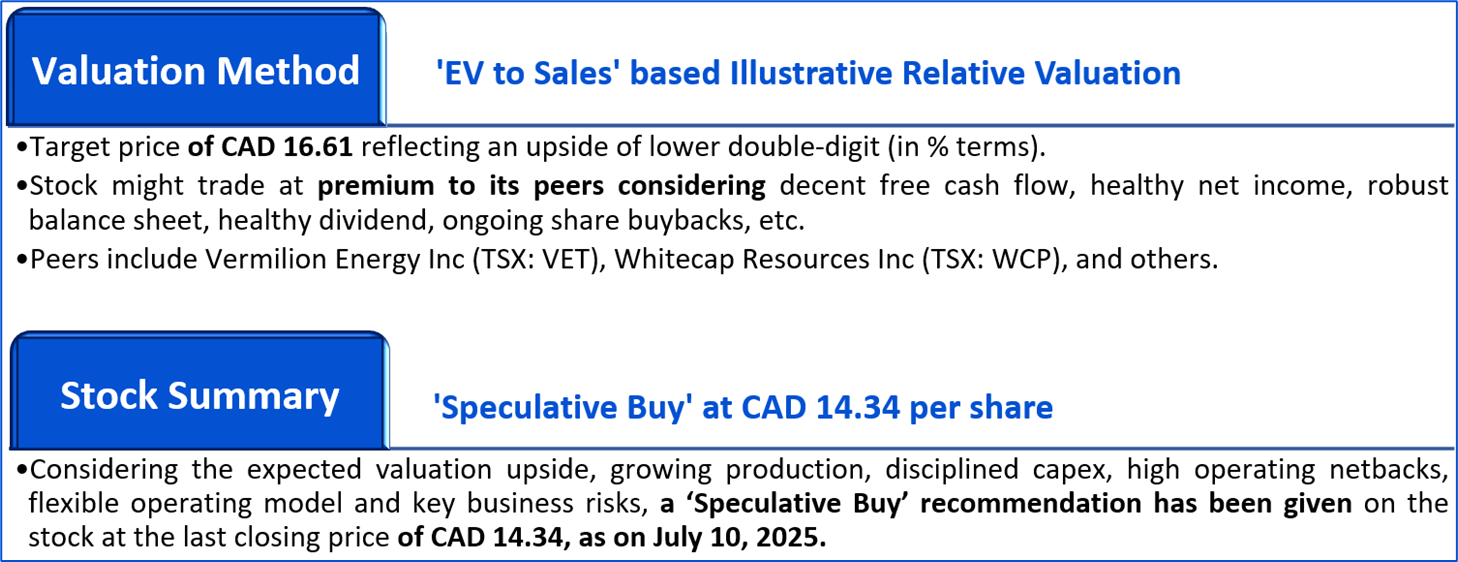
Valuation Methodology: EV to Sales Based Relative Valuation (Illustrative):


The stock has witnessed an upside of ~0.84% and ~32.65% over the last 1 week and 3 months respectively. Moreover, it is trading below the average 52-week high price of CAD 21.79 and 52-week low price of CAD 10.30, providing an opportunity to accumulate the stock.

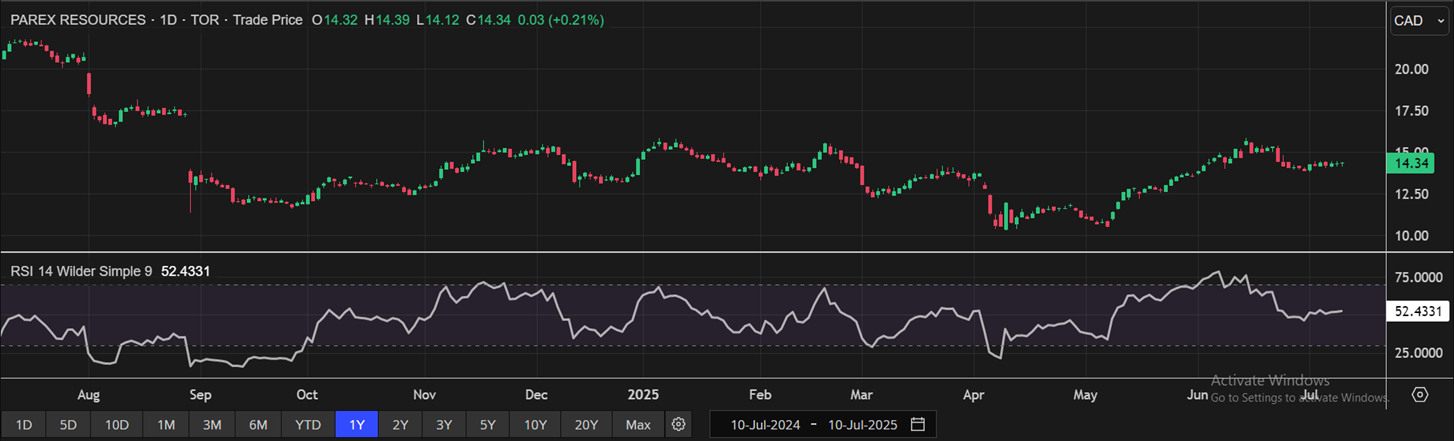
One-Year Technical Price Chart (as of July 10, 2025). Source: REFINITIV, Analysis: Kalkine Group

Note 1: Past performance is not a reliable indicator of future performance.
Note 2: The reference date for all price data, currency, technical indicators, support, and resistance levels is July 10, 2025. The reference data in this report has been partly sourced from REFINITIV.
Note 3: Investment decisions should be made depending on an individual's appetite for upside potential, risks, holding duration, and any previous holdings. An 'Exit' from the stock can be considered if the Target Price mentioned as per the Valuation and or the technical levels provided has been achieved and is subject to the factors discussed above.
Note 4: Dividend Yield may vary as per the stock price movement.
Note 5: Kalkine reports are prepared based on the stock prices captured either from REFINITIV or Trading View. Typically, REFINITIV or Trading View may reflect stock prices with a delay which could be a lag of 25-30 minutes. There can be no assurance that future results or events will be consistent with the information provided in the report. The information is subject to change without any prior notice.
Technical Indicators Defined: -
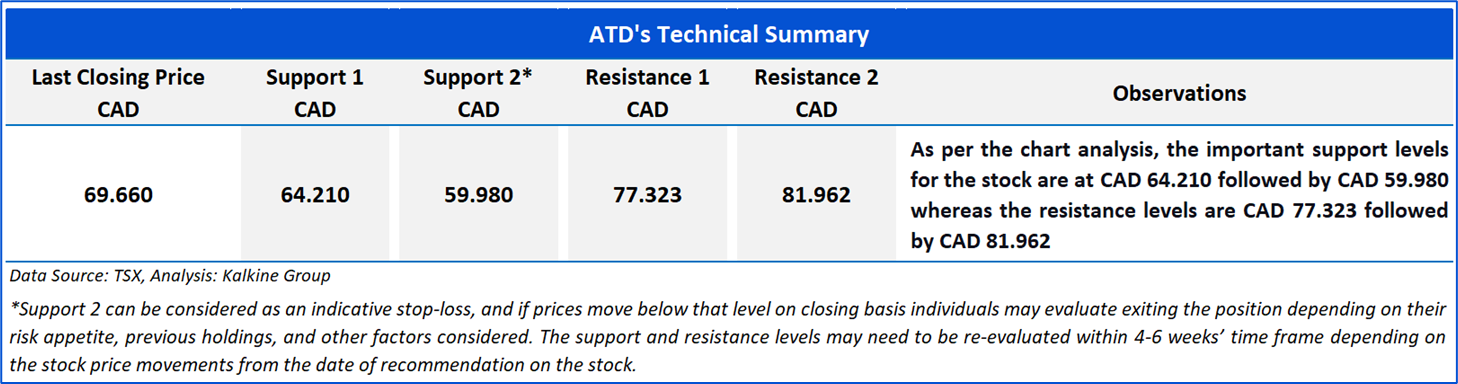
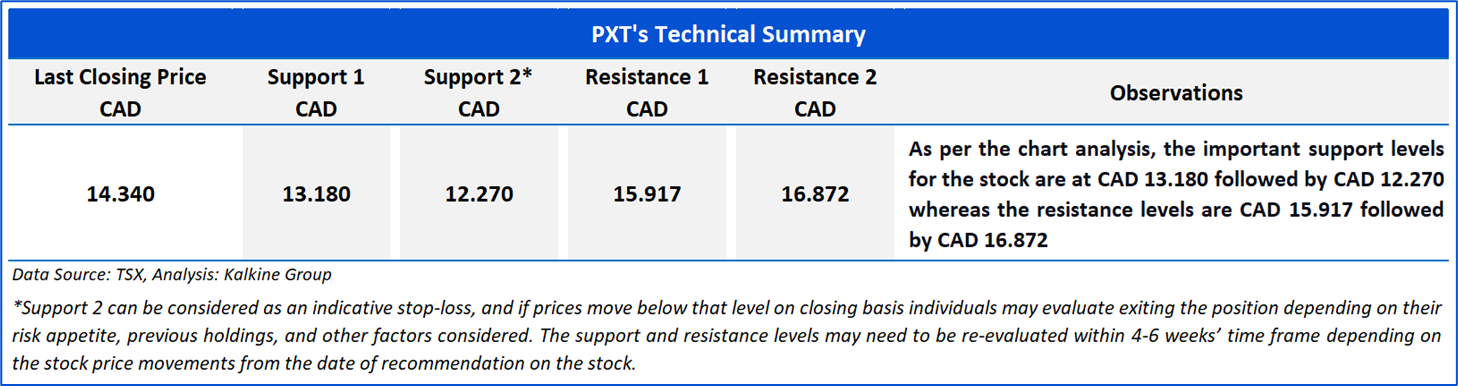
Support: A level at which the stock prices tend to find support if they are falling, and a downtrend may take a pause backed by demand or buying interest.
Resistance: A level at which the stock prices tend to find resistance when they are rising, and the uptrend may take a pause due to profit booking or selling interest.
Stop-loss: In general, it is a level to protect further losses in case of any unfavourable movement in the stock prices.
Past performance is not a reliable indicator of future performance.

 Please wait processing your request...