Overview
Dynamic Core ETF Report covers an innovative investment product, an actively managed ETF that seek capital appreciation by investing in U.S. equities and other instruments. It dynamically adjusts its exposure based on market volatility, aiming to reduce risk during turbulent periods and increase exposure when conditions are favourable, providing a flexible strategy to manage market fluctuations.
This week’s report covers Direxion Daily Aerospace & Defense Bull 3X Shares (NYSE: DFEN) & Leverage Shares 2X Long LAC Daily ETF (NASDAQ: LACG) which are ‘Directional Leveraged ETFs’ that use financial derivatives and debt to amplify the returns of an underlying index, typically by 2x or 3x. These leveraged ETFs aim to provide magnified exposure to the price movements of a specific asset class, either in the direction of rising (bullish) or falling (bearish) prices.
Section 1: Direxion Daily Aerospace & Defense Bull 3X Shares
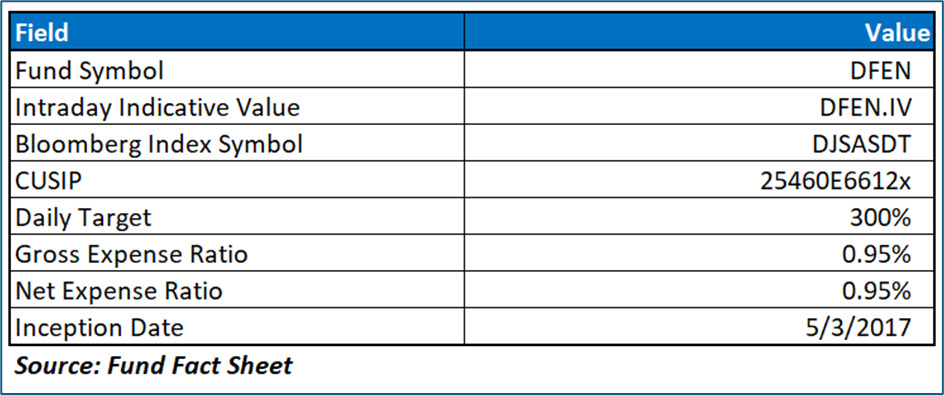
The Fund seeks daily leveraged investment results of three times (300%) the daily percentage change in the share price of Direxion Daily Aerospace & Defense Bull 3X Shares (NYSE: DFEN). The Fund may enter into one or more swap agreements with financial institutions for a specified period, which may range from one day to longer than a year.
Its performance over extended periods diverges from the expected 300% due to the compounding effect of daily returns, which is influenced by factors like holding duration and stock volatility. High volatility amplifies the impact of compounding, potentially leading to significant deviations from the underlying stock’s performance. Consequently, this ETF is designed for short-term trading rather than buy-and-hold strategies.

Section 2: Technical Analysis on ETF and Underlying Asset
NYSE: DFEN
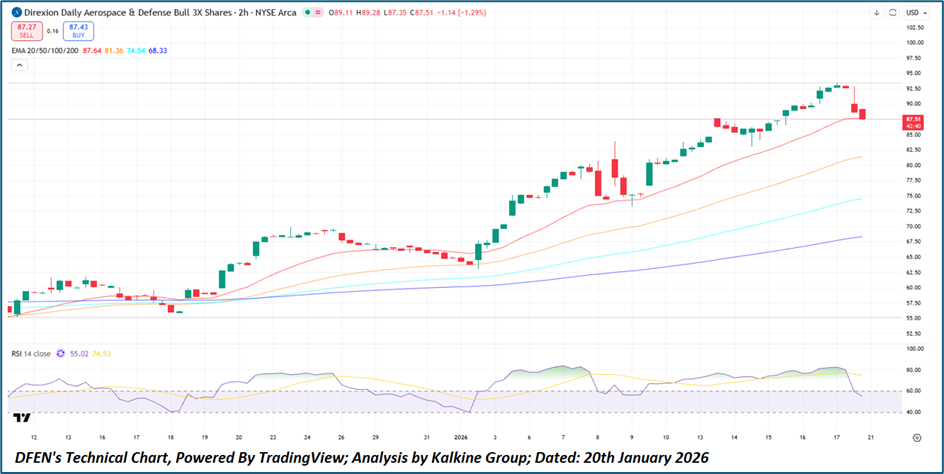
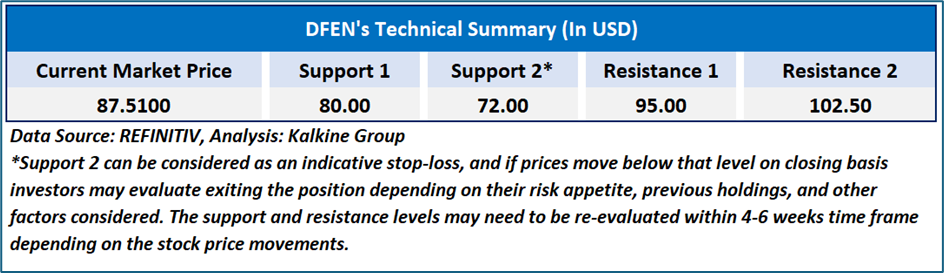
Direxion Daily Aerospace & Defense Bull 3X Shares (DFEN) continues to exhibit a constructive medium-term technical structure despite the recent pullback, with price action remaining above the rising 50-day, 100-day, and 200-day exponential moving averages, which confirms the persistence of an underlying bullish trend. The short-term correction from recent highs appears orderly and has brought the price closer to the 20-day EMA, suggesting a consolidation phase rather than a breakdown. Momentum has moderated, with the 14-day RSI easing toward the mid-50s from overbought levels, indicating a reset in momentum without a loss of trend integrity. Overall, the technical setup remains favorable, with the broader uptrend intact, while near-term price action is consistent with healthy consolidation following a strong advance.
Section 1: Leverage Shares 2X Long LAC Daily ETF (NASDAQ: LACG)
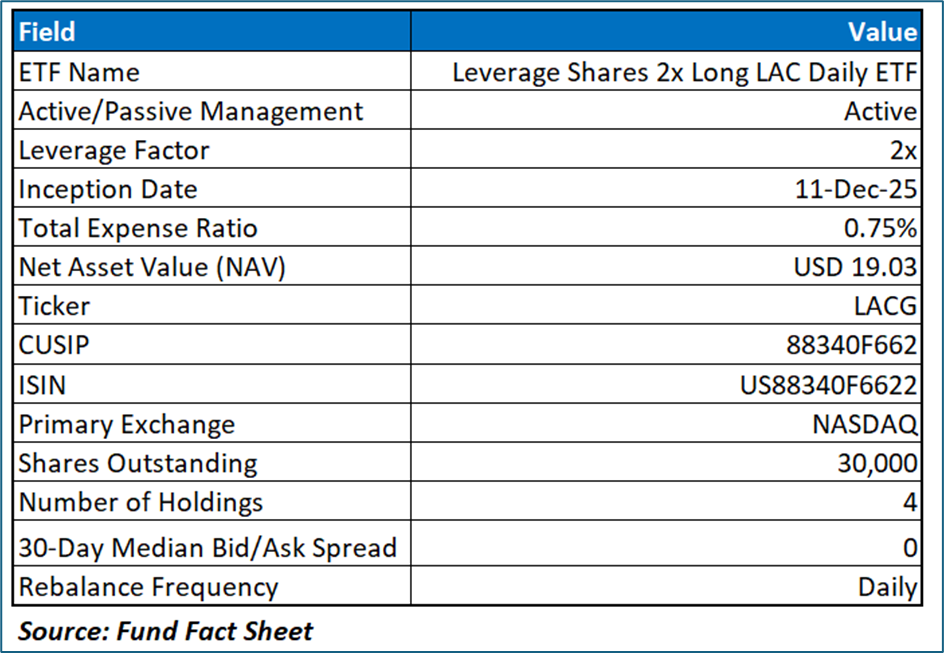
The Fund seeks daily investment results, before fees and expenses, of two times (200%) the daily percentage change in the share price of Leverage Shares 2X Long LAC Daily ETF (NASDAQ: LACG). The Fund is an actively managed ETF that attempts to achieve two times the daily percentage change in the share price of the Underlying Security.
Its performance over extended periods diverges from the expected 200% due to the compounding effect of daily returns, which is influenced by factors like holding duration and stock volatility. High volatility amplifies the impact of compounding, potentially leading to significant deviations from the underlying stock’s performance. Consequently, this ETF is designed for short-term trading rather than buy-and-hold strategies.
Underlying Stock: Lithium Americas Corporation
Lithium Americas Corp. is a Canada-based lithium company. The Company focused on developing, building, and operating lithium deposits and chemical processing facilities. The Company’s flagship asset is Thacker Pass, a sedimentary-based lithium deposit located in the McDermitt Caldera in Humboldt County, in northern Nevada.

Section 2: Technical Analysis on ETF and Underlying Asset
NASDAQ: LACG
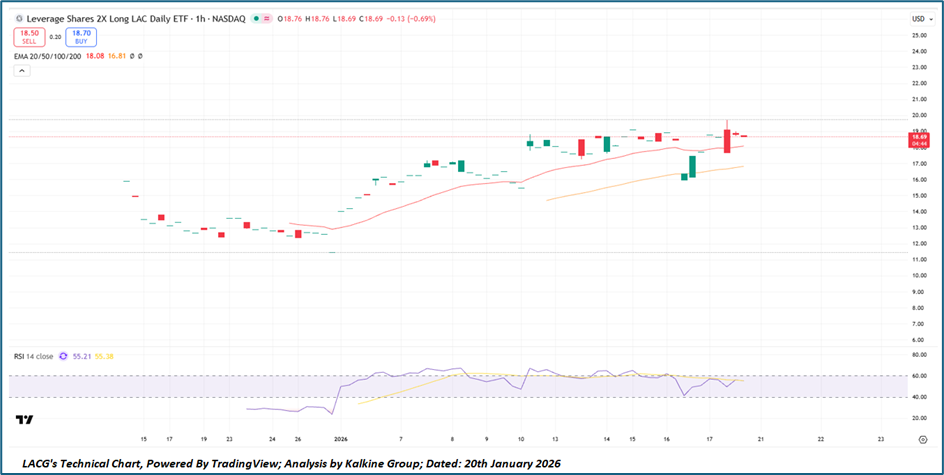
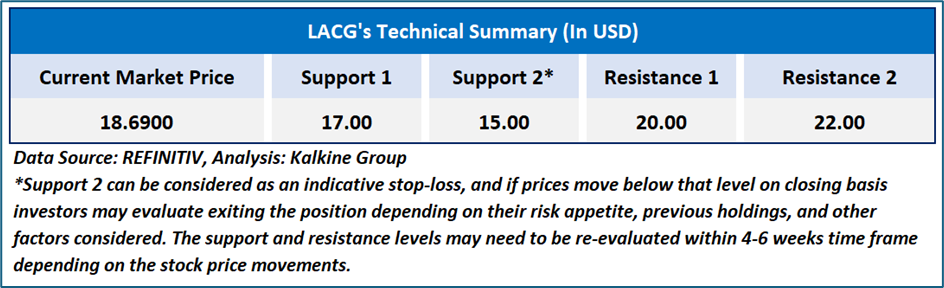
Leverage Shares 2x Long LAC Daily ETF (LACG) is exhibiting a constructive short-term technical profile, with price consolidating around the USD 18.5–18.8 region following a steady advance from earlier lows. The ETF remains positioned above its rising 20-day and 50-day exponential moving averages, indicating preservation of near-term trend support and orderly price behavior despite recent minor pullbacks. Momentum indicators are neutral to moderately positive, with the 14-day RSI holding near the mid-50s, suggesting balanced conditions without signs of exhaustion. Overall, the chart structure reflects a phase of consolidation within an emerging uptrend, with technical conditions supportive of trend continuation provided price holds above short-term moving-average support.
Underlying Asset Analysis: Lithium Americas Corporation
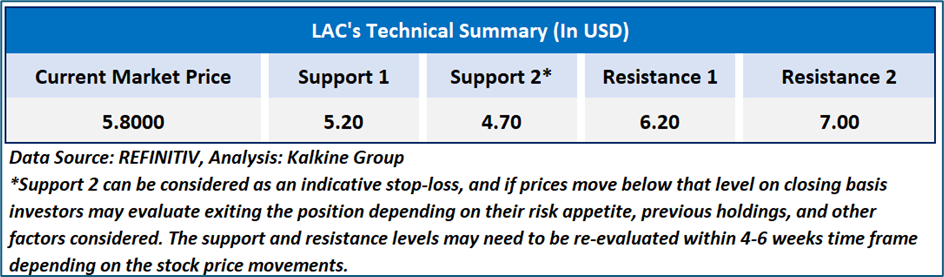
Lithium Americas Corp (LAC) is exhibiting a stabilising technical structure following a sustained corrective phase, with price currently consolidating around the USD 5.7–5.9 zone after a measured recovery from recent lows. The stock is trading marginally above its 50-day and 100-day exponential moving averages, while the 200-day moving average remains overhead, indicating that the broader trend is transitioning from bearish to neutral rather than fully bullish. Short-term moving averages are beginning to flatten and converge, reflecting improving price balance and reduced downside momentum. The 14-day RSI near the low-50s suggests neutral momentum conditions, neither overbought nor oversold, and consistent with consolidation after a rebound. Overall, the technical setup points to a base-building phase, with further confirmation required through a sustained break above medium-term resistance levels to signal a stronger trend reversal.
Related Risk: Investing in the Fund carries inherent risks, including potential losses. The Fund's NAV and performance are influenced by various factors. Key risks include the effects of compounding, market volatility, and underlying stock risks, which can significantly impact returns and increase the likelihood of financial losses.
Note 1: Past performance is not a reliable indicator of future performance.
Note 2: The reference date for all price data, currency, technical indicators, support, and resistance level is January 20, 2026. The reference data in this report has been partly sourced from REFINITIV
Note 3: ‘Kalkine reports are prepared based on the stock prices captured either from the New York Stock Exchange (NYSE), NASDAQ Capital Markets (NASDAQ), and or REFINITIV. Typically, all sources (NYSE, NASDAQ, or REFINITIV) may reflect stock prices with a delay which could be a lag of 25-30 minutes. There can be no assurance that future results or events will be consistent with the information provided in the report. The information is subject to change without any prior notice.
Past performance is not a reliable indicator of future performance.

 NZ
 UK
 US
 AU
 IND

 CA

 Please wait processing your request...