Section 1: Company Overview and Fundamentals
1.1 Company Overview:
Uber Technologies, Inc (NYSE: UBER) operates a technology platform that enables the movement of people and goods through digital applications. The company operates across three segments Mobility, Delivery, and Freight. The Mobility segment connects riders with drivers for transportation services using various vehicles, while the Delivery segment allows consumers to order food, groceries, alcohol, and other goods from local merchants. The Freight segment links carriers with shippers, providing pricing visibility and shipment booking along with logistics and transportation management services.
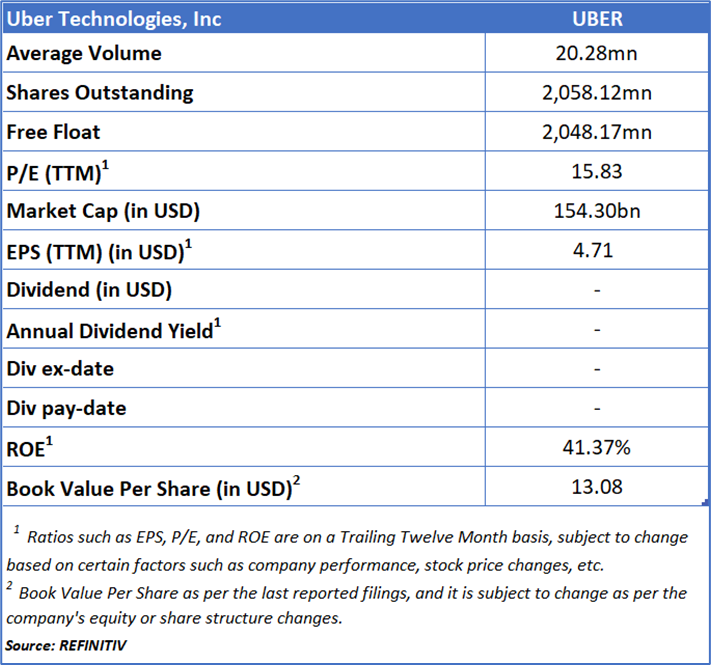
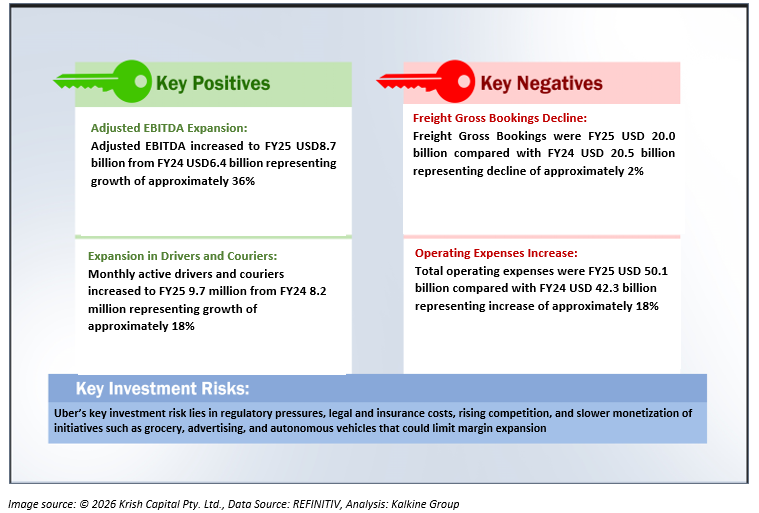
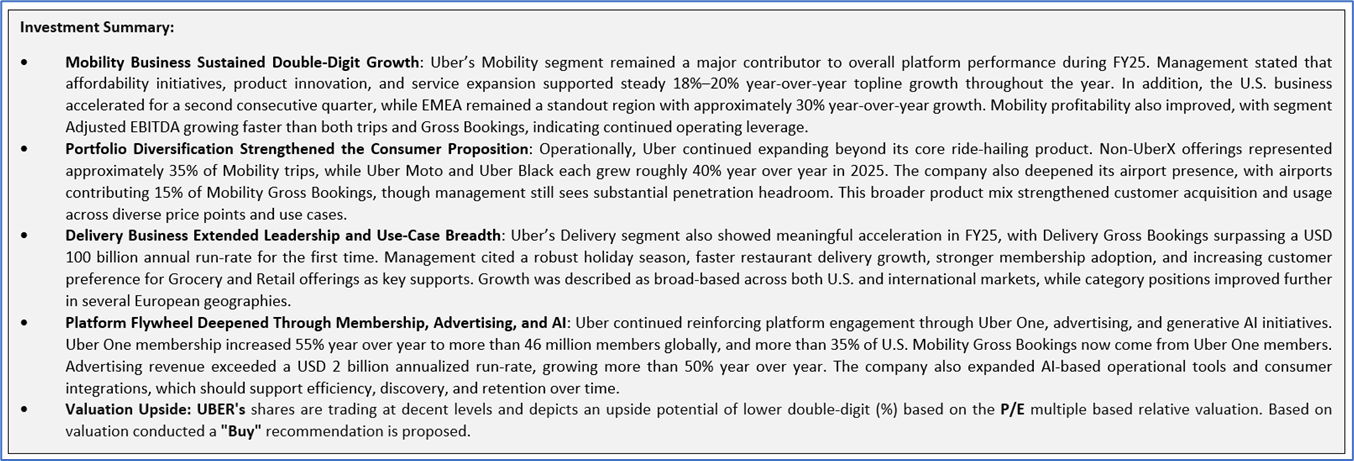
Kalkine’s Diversified Opportunities Report covers the Company Overview, Key positives & negatives, Investment summary, Key investment metrics, Top 10 shareholding, Business updates and insights into company recent financial results, Key Risks & Outlook, Price performance and technical summary, Target Price, and Recommendation on the stock.
Stock Performance:
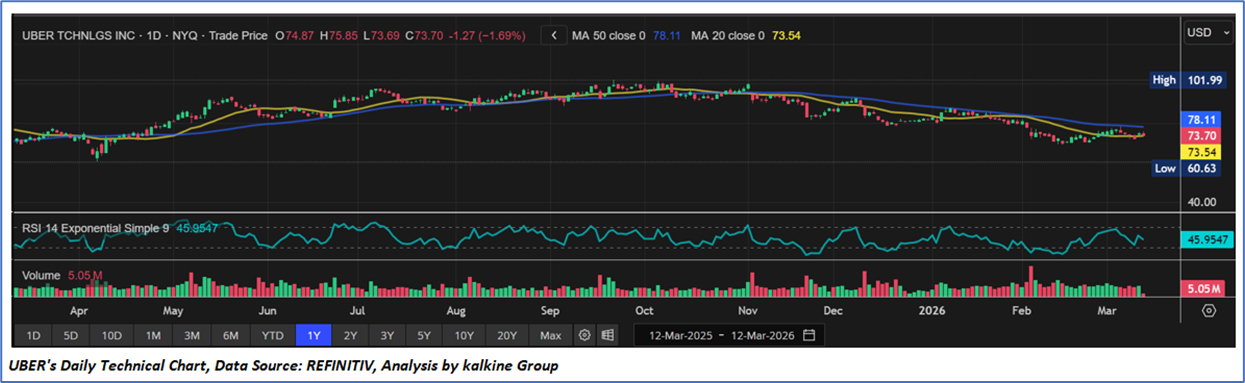
- The stock has declined from its prior peak near USD 102 and is currently trading in a consolidation phase, indicating stabilization after the earlier downtrend.
- Price remains below the 50-day moving average at USD 78.11 while trading close to the 20-day moving average at USD 73.54, suggesting short-term weakness but signs of base formation.
- The USD 73–74 range is acting as immediate support, where buying interest has recently emerged.
- The RSI stands near 46, reflecting neutral momentum and indicating that the stock is neither overbought nor oversold.
- Trading volumes remain moderate, suggesting limited conviction among market participants during the consolidation phase.
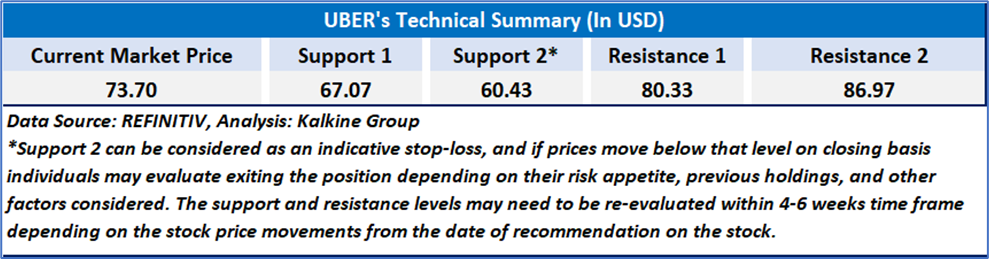
- A sustained breakout above USD 78–80 could improve short-term momentum and potentially move the stock toward the USD 85–90 range.
- Conversely, a break below USD 70 may increase downside risk and expose the stock to a retest of the USD 60–65 support zone.
1.2 The Key Positives, Negatives, and Investment summary
1.3 Top 10 shareholders:
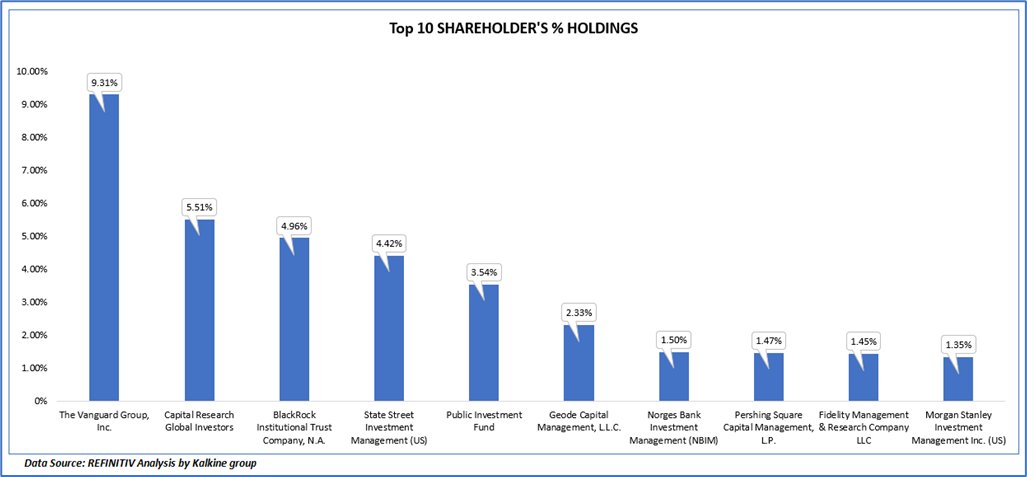
The top 10 shareholders together form ~ 35.83% of the total shareholding, signifying concentrated shareholding. The Vanguard Group, Inc. and Capital Research Global Investors are the biggest shareholders, holding the maximum stake in the company at 9.31% and 5.51%, respectively.
1.4 Key Metrics:
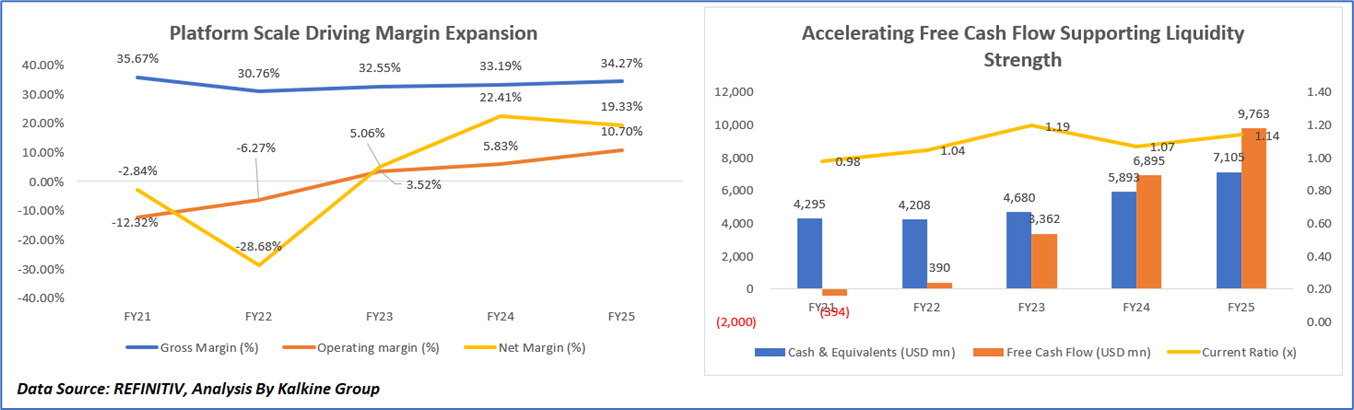
Platform Scale Driving Margin Expansion
Profitability chart illustrates Uber’s margin trajectory from FY21 to FY25, reflecting the company’s transition from pandemic-driven volatility to scaled profitability. In FY21 and FY22, operating and net margins were pressured by heavy investments in driver incentives, marketplace balancing, and expansion across delivery, grocery, and logistics services despite improving demand. From FY23 onward, margins improved significantly as higher trip volumes, stronger consumer engagement, and improved marketplace efficiency generated operating leverage across the platform. Continued growth in mobility and delivery, rising cross-platform usage, expansion of the Uber One membership program, and disciplined cost management further supported profitability expansion in FY24 and FY25, enabling stronger operating margins and sustained net margin recovery alongside record EBITDA and free cash flow generation.
Accelerating Free Cash Flow Supporting Liquidity Strength
Liquidity chart reflects Uber’s improving liquidity position and accelerating free cash flow generation from FY21 to FY25, driven by the company’s transition from a high-investment growth phase toward scaled profitability and disciplined capital management. In FY21 and FY22, free cash flow remained weak as the company invested heavily in driver incentives, marketplace balancing, and expansion across delivery, freight, and new verticals, while the business was still recovering from pandemic disruptions. From FY23 onward, free cash flow improved significantly as higher trip volumes, stronger consumer engagement, and improved operating efficiency enhanced cash generation across the platform. Continued growth in mobility and delivery, expansion of Uber One membership, increasing multi-product usage, and improved cost discipline supported stronger operating leverage. By FY24 and FY25, these factors enabled Uber to generate substantial free cash flow while simultaneously increasing its cash reserves and maintaining a stable current ratio, reflecting improved financial flexibility and stronger balance sheet resilience.
Section 2: Business Updates and Corporate Business Highlights
2.1 Recent Business Updates
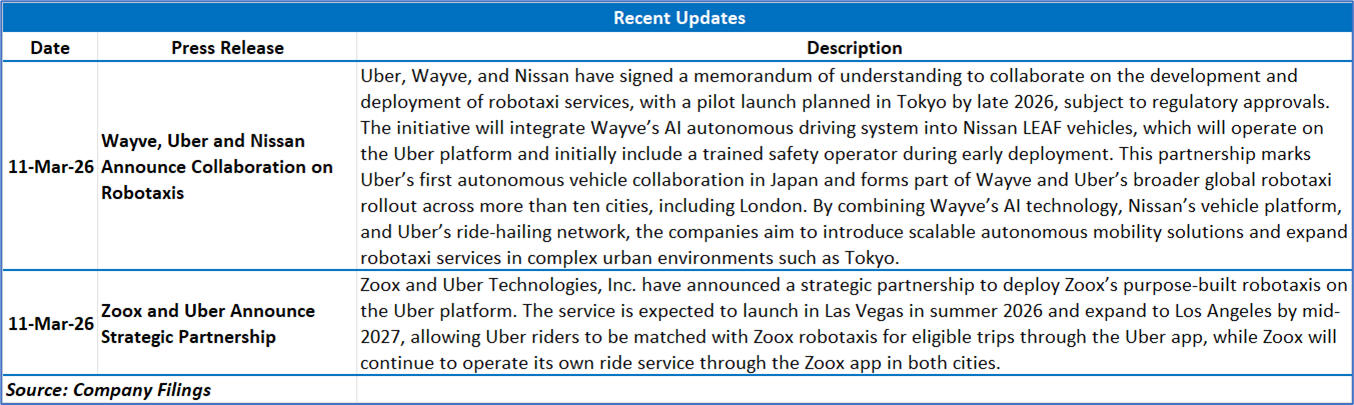
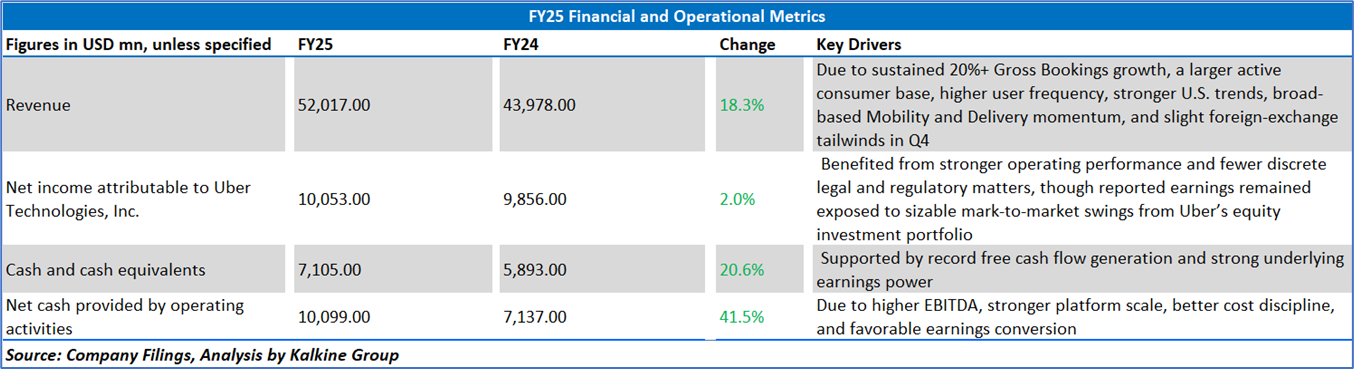
2.2 Insights of FY25:
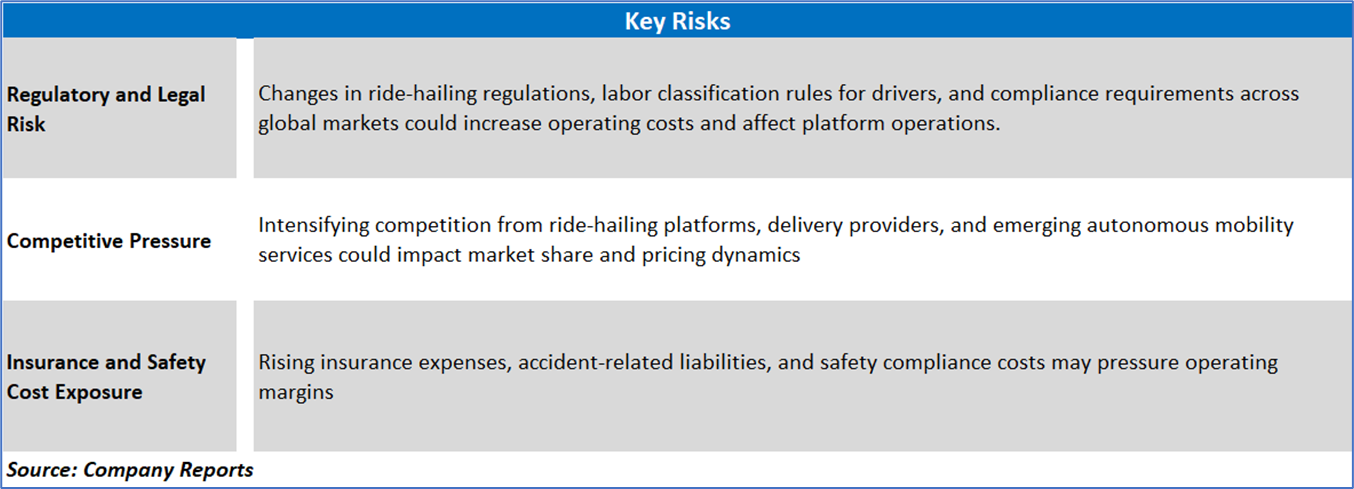
Section 3: Key Risks & Outlook

Section 4: Stock Recommendation Summary:
4.1 Price Performance and Technical Summary:
Stock Performance:
- The stock has declined from its prior peak near USD 102 and is currently trading in a consolidation phase, indicating stabilization after the earlier downtrend.
- Price remains below the 50-day moving average at USD 78.11 while trading close to the 20-day moving average at USD 73.54, suggesting short-term weakness but signs of base formation.
- The USD 73–74 range is acting as immediate support, where buying interest has recently emerged.
- The RSI stands near 46, reflecting neutral momentum and indicating that the stock is neither overbought nor oversold.
- Trading volumes remain moderate, suggesting limited conviction among market participants during the consolidation phase.
- A sustained breakout above USD 78–80 could improve short-term momentum and potentially move the stock toward the USD 85–90 range.
- Conversely, a break below USD 70 may increase downside risk and expose the stock to a retest of the USD 60–65 support zone.
4.2 Fundamental Valuation
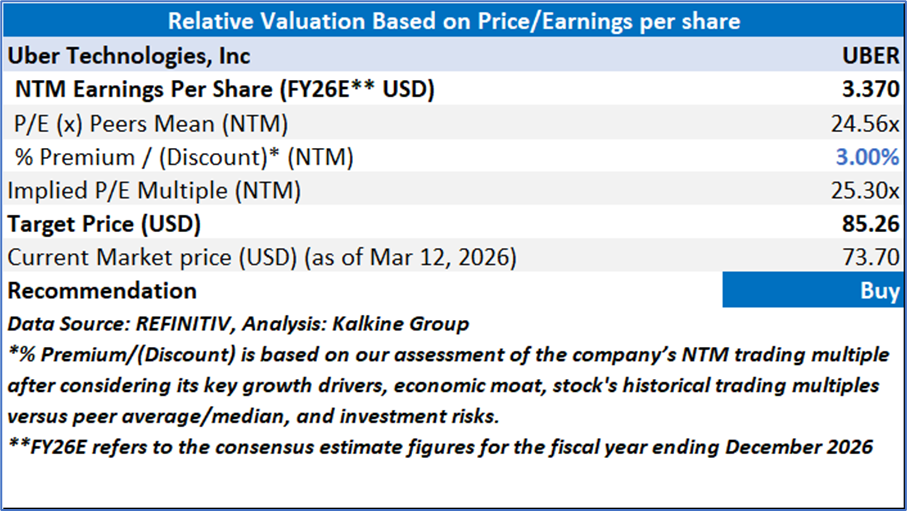
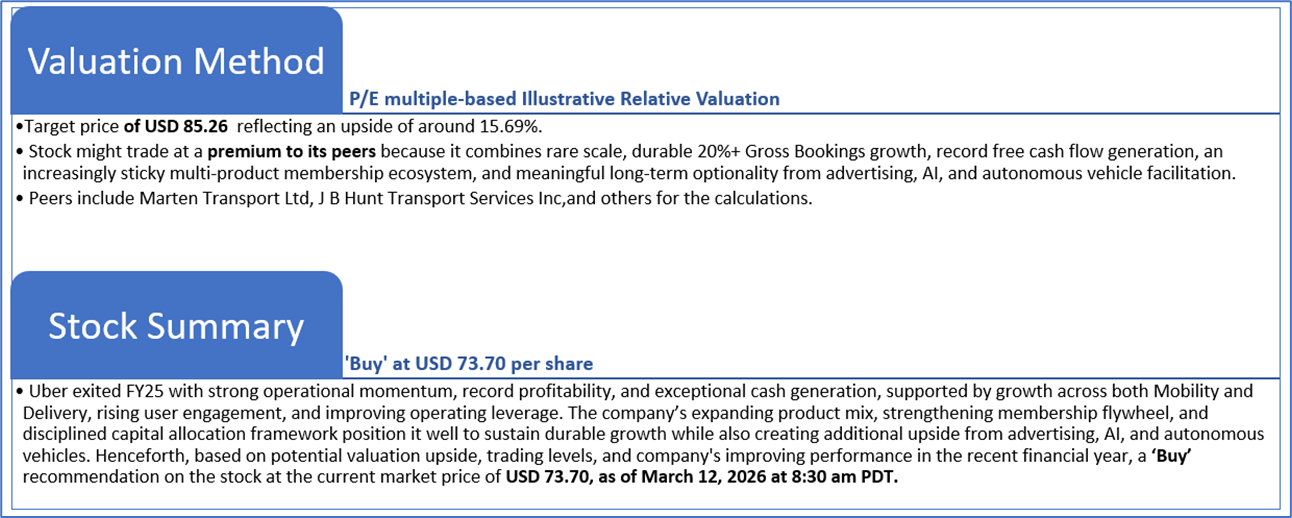
Valuation Methodology: Price/Earnings Multiple Based Relative Valuation
Markets are trading in a highly volatile zone currently due to certain macroeconomic issues and geopolitical tensions prevailing. Therefore, it is prudent to follow a cautious approach while investing.
Note 1: Past performance is not a reliable indicator of future performance.
Note 2: The reference date for all price data, currency, technical indicators, support, and resistance levels is March 12, 2026. The reference data in this report has been partly sourced from REFINITIV.
Note 3: Investment decisions should be made depending on an individual's appetite for upside potential, risks, holding duration, and any previous holdings. An 'Exit' from the stock can be considered if the Target Price mentioned as per the Valuation and or the technical levels provided has been achieved and is subject to the factors discussed above.
Note 4: The report publishing date is as per the Pacific Time Zone.
Technical Indicators Defined: -
Support: A level at which the stock prices tend to find support if they are falling, and a downtrend may take a pause backed by demand or buying interest. Support 1 refers to the nearby support level for the stock and if the price breaches the level, then Support 2 may act as the crucial support level for the stock.
Resistance: A level at which the stock prices tend to find resistance when they are rising, and an uptrend may take a pause due to profit booking or selling interest. Resistance 1 refers to the nearby resistance level for the stock and if the price surpasses the level, then Resistance 2 may act as the crucial resistance level for the stock.
Stop-loss: It is a level to protect against further losses in case of unfavorable movement in the stock prices.
Past performance is not a reliable indicator of future performance.

 NZ
 UK
 US
 AU
 IND

 CA

 Please wait processing your request...