Nokia Corporation
Nokia Corporation (NYSE: NOK) is a Finland-based telecommunications and technology company focused on network infrastructure, Internet protocol (IP) systems, software solutions, and related services. Its operations are organized into key segments, including Ultra Broadband Networks (covering mobile and fixed networks), IP Networks and Applications (including IP/optical networks and software-driven analytics platforms), and Nokia Technologies. The company provides a wide range of solutions such as network management, cloud, IoT, security, and customer experience tools, serving telecom operators and enterprises globally.

Key Growth Aspects
- Strong Revenue Growth Supported by AI & Cloud Demand: Nokia delivered a solid start to FY2026, with comparable net sales increasing by 4% year-on-year on a constant currency basis, reflecting improving demand trends across key segments. The growth was primarily driven by Network Infrastructure, which expanded 6%, supported by a sharp 20% surge in Optical Networks. Notably, AI & Cloud revenues emerged as a significant growth driver, rising 49% and contributing meaningfully to overall sales, highlighting Nokia’s successful positioning in high-growth digital infrastructure markets.
- Margin Expansion Reflecting Operational Efficiency: The company demonstrated strong operational leverage during the quarter, with comparable gross margin expanding by 320 basis points to 45.5% and operating margin improving by 200 basis points to 6.2%. This margin improvement was driven by a favorable product mix, absence of prior one-off charges, and scaling benefits in high-margin segments such as Optical Networks. Additionally, Mobile Infrastructure delivered robust profitability with operating margin rising to 8.9%, supported by cost optimization initiatives and improved product mix.
- Significant Profitability and Earnings Improvement: Nokia reported a strong turnaround in profitability, with comparable operating profit rising 54% year-on-year to EUR 281 million, while comparable net profit nearly doubled to EUR 295 million. Earnings per share also improved materially, increasing to EUR 0.05 from EUR 0.03 in the prior year period. The improvement reflects not only revenue growth but also disciplined cost management and positive contributions from financial income, reinforcing the company’s improving earnings quality.
- Robust Cash Flow Generation and Balance Sheet Strength: The company maintained a strong financial position, generating free cash flow of approximately EUR 0.6 billion during the quarter and increasing net cash to EUR 3.8 billion. Operating cash flows were supported by favorable working capital movements, including reductions in receivables and increases in liabilities. This strong liquidity position enhances Nokia’s ability to invest in growth initiatives, particularly in AI-driven infrastructure, while maintaining shareholder returns through dividends.
Growth Challenges
- Weakness in Fixed Networks and Select Segments: Despite overall growth, Nokia faced pressure in certain business units, particularly Fixed Networks, where net sales declined by 13% on a constant currency basis. This decline reflects reduced demand for consumer premise fiber products and the company’s strategic shift toward higher-margin offerings. While this repositioning may support margins over time, it continues to weigh on near-term revenue growth and segment performance.
- Regional and Customer Concentration Challenges: The company experienced uneven regional performance, with APAC revenues declining by 9% and continued softness in telecommunication provider spending, where revenues fell 5% year-on-year. Additionally, dependence on telecom operators remains a structural challenge, as these customers continue to moderate capital expenditure, partially offsetting gains from AI & Cloud segments.
- Rising Operating Expenses and Integration Costs: Operating expenses increased during the quarter due to ongoing investments in growth areas and the impact of the Infinera acquisition. While these investments are aligned with long-term strategy, they continue to exert pressure on reported profitability. Additionally, restructuring charges and integration-related costs remain elevated, creating a gap between reported and comparable earnings performance.
- Exposure to Macro and Industry Volatility: Nokia’s performance remains sensitive to macroeconomic conditions, including currency fluctuations, supply chain disruptions, and variability in customer investment cycles. Foreign exchange headwinds negatively impacted reported growth, while extended lead times and supply chain pressures could affect execution. Furthermore, reliance on large infrastructure cycles introduces volatility in order flows and revenue realization.
Key Risks:
- Dependence on Telecom Capex Cycles: Variability in operator spending may impact revenue visibility.
- Execution Risk in AI & Cloud Expansion: Scaling new growth segments may involve operational and competitive challenges.
- Integration and Restructuring Risks: Ongoing acquisitions and cost programs may affect profitability.
- Macroeconomic and Currency Volatility: FX fluctuations and global uncertainties could impact financial performance.
Technical Observation (on the daily chart):
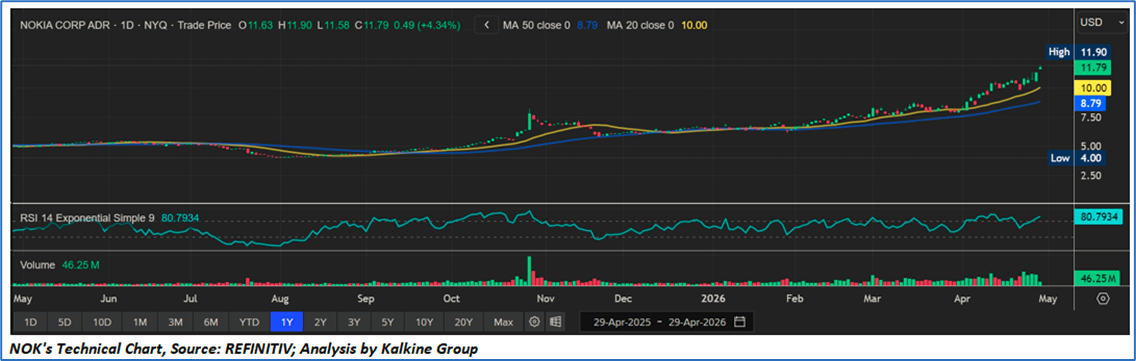
- The chart indicates a strong bullish trend, with consistent higher highs and higher lows over the past year.
- A recent breakout above the USD 10 resistance level signals continued upward momentum, with price nearing the USD 11.8–12.0 range.
- The 20-day moving average is above the 50-day moving average, and both are trending upward, confirming sustained bullish strength.
- The widening gap between moving averages reflects increasing trend momentum rather than weakness.
- The RSI is around 80, indicating overbought conditions, which may lead to short-term consolidation but also reflects strong buying momentum.
- Volume trends show accumulation, with spikes during upward moves supporting the ongoing rally.
Nokia’s Q1 FY2026 performance reflects a balanced trajectory, with strong growth in AI & Cloud and Optical Networks driving revenue and margin expansion, while structural challenges in legacy segments and regional demand variability persist. The company’s improving profitability and strong cash generation support its strategic investments; however, execution risks, cost pressures, and uneven segment performance continue to moderate the overall outlook.
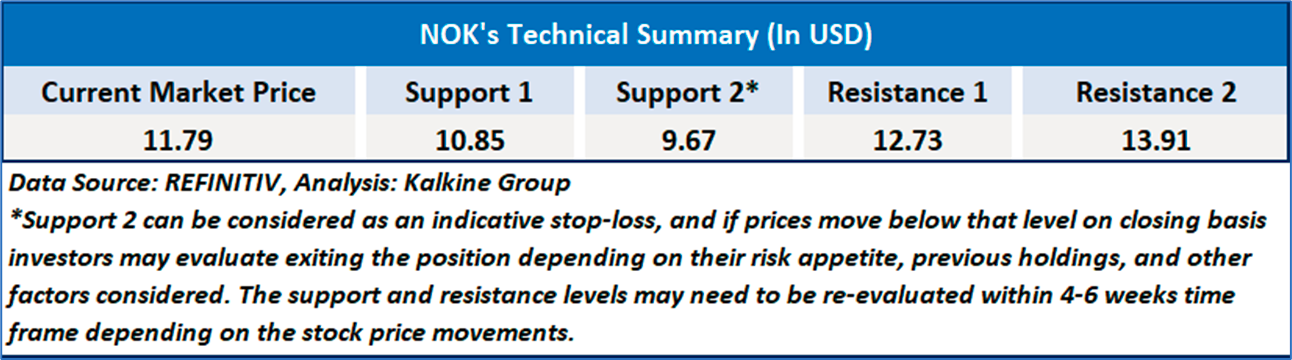
As per the above-mentioned price action, recent key business and financial updates, momentum in the stock over the last month, and technical indicators analysis, a ‘Watch’ rating has been Nokia Corporation (NYSE: NOK) at the current market price of USD 11.79 as of April 29,2026 at 7:42 am PDT.
Individuals can evaluate the stock based on the support and resistance levels provided in the report in case of keen interest taking into consideration the risk-reward scenario.
Markets are trading in a highly volatile zone currently due to certain macro-economic issues and prevailing geopolitical tensions. Therefore, it is prudent to follow a cautious approach while investing.
Related Risk: This report may be looked at from a high-risk perspective and a recommendation is provided for a short duration. This report is solely based on technical parameters, and the fundamental performance of the stocks has not been considered in the decision-making process. Other factors which could impact the stock prices include market risks, regulatory risks, interest rates risks, currency risks, social and political instability risks etc.
Note 1: Past performance is not a reliable indicator of future performance.
Note 2: The reference date for all price data, currency, technical indicators, support, and resistance level is April 29,2026. The reference data in this report has been partly sourced from REFINITIV.
Note 3: Investment decisions should be made depending on an individual's appetite for upside potential, risks, holding duration, and any previous holdings. An 'Exit' from the stock can be considered if the Target Price mentioned as per the Valuation and or the technical levels provided has been achieved and is subject to the factors discussed above.
Note 4: Target Price refers to a price level that the stock is expected to reach as per the relative valuation method and or technical analysis taking into consideration both short-term and long-term scenarios.
Note 5: ‘Kalkine reports are prepared based on the stock prices captured either from the New York Stock Exchange (NYSE), NASDAQ Capital Markets (NASDAQ), and or REFINITIV. Typically, all sources (NYSE, NASDAQ, or REFINITIV) may reflect stock prices with a delay which could be a lag of 15-20 minutes. There can be no assurance that future results or events will be consistent with the information provided in the report. The information is subject to change without any prior notice.

 NZ
 UK
 US
 AU
 IND

 CA

 Please wait processing your request...