Xerox Holdings Corporation
Xerox Holdings Corporation (NASDAQ: XRX) is a workplace technology company building and integrating software and hardware for enterprises. Its segments include Print and Other and Xerox Financial Services (XFS).

Key Business & Financial Updates:
- Revenue Performance and Growth Quality: Xerox Holdings Corporation (XRX) reported Q1 2026 revenue of approximately USD 1.85 billion, reflecting a strong year-over-year increase of 26.7% (23.6% in constant currency). However, on a pro forma basis which adjusts for acquisitions such as Lexmark revenue declined by 3.7%, indicating that underlying organic growth remains weak. This divergence highlights that the reported top-line expansion is largely acquisition-driven rather than reflective of sustained demand improvement in core operations.
- Profitability Trends and Margin Expansion: The company demonstrated meaningful improvement in operating profitability, with adjusted operating income rising to USD 72 million, USD 50 million year over year. Adjusted operating margins expanded significantly by 240 basis points to 3.9%, indicating early success in cost optimization and efficiency initiatives. Gross margins also improved modestly, reflecting better pricing discipline and operational leverage. Despite these gains, overall profitability remains constrained, suggesting that Xerox is still in the early stages of a margin recovery cycle.
- Earnings Profile and Net Loss Position: Xerox continues to report net losses across multiple earnings metrics. GAAP’s net loss stood at USD 105 million, while adjusted net loss was USD 51 million, both reflecting year-over-year deterioration. Even normalized adjusted losses, which exclude certain tax impacts, remain negative. This persistent loss profile indicates that, despite improvements at the operating level, bottom-line recovery has not yet materialized, primarily due to restructuring costs, financing expenses, and other non-operating factors.
- Cash Flow Dynamics and Liquidity Position: Cash flow generation in Q1 was notably weak, with operating cash flow at negative USD 144 million and free cash flow at negative USD 165 million, reflecting typical first-quarter seasonality but still highlighting near-term liquidity pressure. However, management has reiterated full-year free cash flow guidance of approximately USD 250 million, implying a substantial recovery in cash generation over the remaining quarters. This introduces execution dependency, as achieving guidance will require consistent operational improvement and working capital normalization.
- Segment Performance and Strategic Outlook: Segment-wise, the Print and Other division remains the primary revenue driver, delivering strong reported growth but declining on a pro forma basis, reinforcing structural challenges in legacy operations. The IT Solutions segment, while smaller, showed modest profit growth but experienced revenue contraction, indicating mixed performance. Strategic initiatives including Lexmark integration synergies, increased production installs, and expansion in IT services suggest a gradual pivot toward a more diversified business model. Additionally, capital actions such as debt repurchase and liquidity enhancement through joint ventures indicate a focus on balance sheet optimization alongside operational turnaround.
Key Risks:
- Structural Demand Erosion Risk: Xerox Holdings Corporation (XRX) continues to face secular decline in its core print business due to digitization and reduced enterprise print usage. This creates persistent pressure on organic revenue growth despite acquisition-led expansion.
- Earnings and Cash Flow Execution Risk: The company remains loss-making with negative free cash flow in the recent quarter, while full-year guidance assumes a sharp recovery. Any execution shortfall in margins or working capital could materially impact liquidity and investor confidence.
- Integration and Leverage Risk: Ongoing integration of acquisitions and reliance on synergy realization introduce operational complexity and execution uncertainty. Additionally, balance sheet leverage and refinancing requirements could constrain financial flexibility if performance improvements lag expectations.
Technical Observation (on the daily chart):
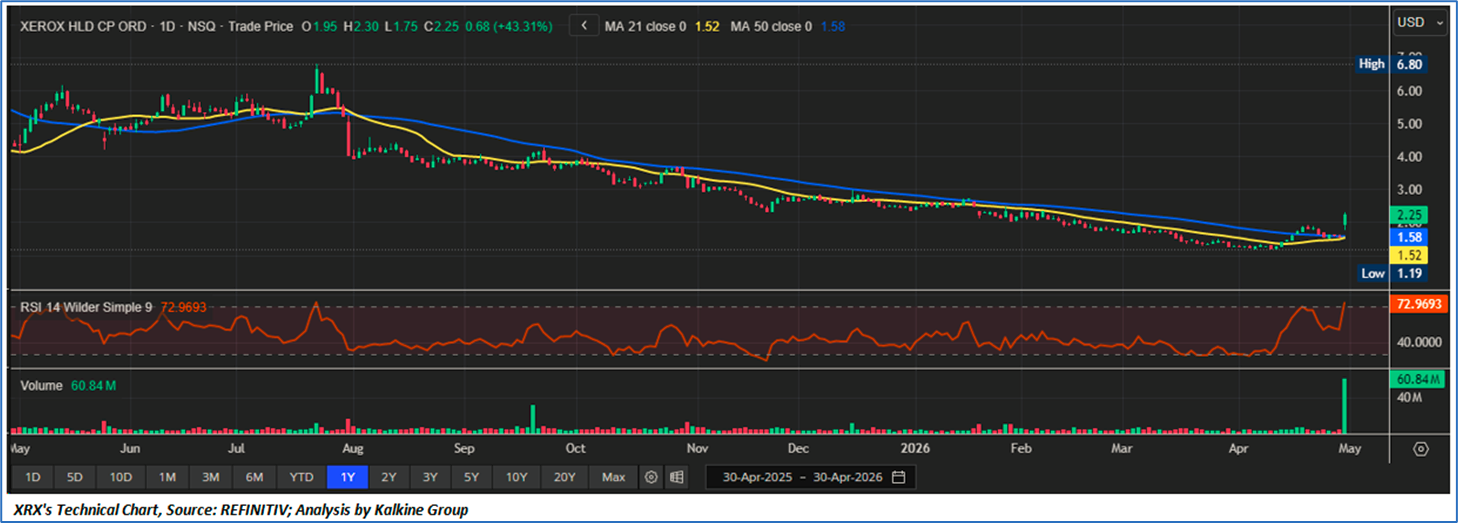
- Trend Structure and Moving Average Dynamics: The broader trend in Xerox Holdings Corp. (XRX) remains structurally bearish, as evidenced by the persistent downward slope across both the 21-day and 50-day moving averages over the past several months. Price action has consistently traded below these key trend indicators, reinforcing a prolonged distribution phase. However, the recent sharp upward price spike accompanied by a decisive move above both short-term moving averages signals a potential short-term trend reversal or, at minimum, a relief rally. The compression of moving averages prior to the breakout suggests reduced volatility followed by expansion, a classic precursor to directional movement. Sustained price acceptance above the 50-day moving average (~1.58 zone) will be critical to validate a transition from bearish to neutral bias.
- Momentum Indicators and RSI Interpretation: The Relative Strength Index (RSI), currently positioned around ~72, indicates that XRX has entered overbought territory in the immediate term. This reflects strong bullish momentum but simultaneously raises the probability of near-term consolidation or pullback. Historically, during downtrends, RSI spikes above 70 tend to be short-lived and often coincide with technical bounces rather than sustained reversals. Notably, prior RSI peaks in the chart have failed to establish higher highs, suggesting weak momentum persistence. Therefore, while the current momentum thrust is significant, traders should monitor whether RSI sustains above the 60–65 range to confirm strengthening bullish structure rather than a transient overextension.
- Volume Expansion and Breakout Validity: The most critical confirming signal in the current setup is the sharp expansion in trading volume, with a notable spike exceeding 60 million shares substantially above historical averages. This surge indicates strong participation and validates the breakout move as institutionally supported rather than purely speculative. Volume-backed breakouts tend to have higher follow-through probability; however, the context of a long-term downtrend necessitates caution. If follow-up sessions maintain elevated volume with higher lows, it would reinforce accumulation dynamics. Conversely, a rapid drop in volume alongside price stagnation would suggest exhaustion. Key support now shifts to the breakout zone (~1.50–1.60), while immediate resistance is observed near the psychological USD2.50–USD3.00 range.
Xerox Holdings Corporation (XRX) delivered a mixed Q1 2026 performance, with strong reported revenue growth primarily driven by acquisitions, alongside notable improvement in operating margins and cost efficiency. However, underlying organic revenue trends remain weak, and the company continues to report net losses with negative near-term cash flows, indicating that the turnaround remains in progress. While strategic initiatives, including integration synergies and business diversification, signal a gradual shift toward a more sustainable operating model, execution risk persists. From a technical standpoint, the stock has exhibited a short-term breakout supported by strong volume and momentum, though the broader trend remains structurally weak, suggesting that the current move may represent an early-stage reversal rather than a confirmed long-term uptrend.
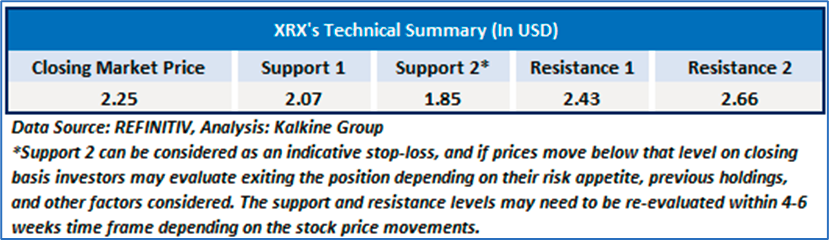
As per the above-mentioned price action, recent key business and financial updates, momentum in the stock over the last month, and technical indicators analysis, a ‘Watch’ rating has been Xerox Holdings Corporation (NASDAQ: XRX) at the closing market price of USD 2.25 as of April 30, 2026.
Individuals can evaluate the stock based on the support and resistance levels provided in the report in case of keen interest taking into consideration the risk-reward scenario.
Markets are trading in a highly volatile zone currently due to certain macro-economic issues and prevailing geopolitical tensions. Therefore, it is prudent to follow a cautious approach while investing.
Related Risk: This report may be looked at from a high-risk perspective and a recommendation is provided for a short duration. This report is solely based on technical parameters, and the fundamental performance of the stocks has not been considered in the decision-making process. Other factors which could impact the stock prices include market risks, regulatory risks, interest rates risks, currency risks, social and political instability risks etc.
Note 1: Past performance is not a reliable indicator of future performance.
Note 2: The reference date for all price data, currency, technical indicators, support, and resistance level is April 30, 2026. The reference data in this report has been partly sourced from REFINITIV.
Note 3: Investment decisions should be made depending on an individual's appetite for upside potential, risks, holding duration, and any previous holdings. An 'Exit' from the stock can be considered if the Target Price mentioned as per the Valuation and or the technical levels provided has been achieved and is subject to the factors discussed above.
Note 4: Target Price refers to a price level that the stock is expected to reach as per the relative valuation method and or technical analysis taking into consideration both short-term and long-term scenarios.
Note 5: ‘Kalkine reports are prepared based on the stock prices captured either from the New York Stock Exchange (NYSE), NASDAQ Capital Markets (NASDAQ), and or REFINITIV. Typically, all sources (NYSE, NASDAQ, or REFINITIV) may reflect stock prices with a delay which could be a lag of 15-20 minutes. There can be no assurance that future results or events will be consistent with the information provided in the report. The information is subject to change without any prior notice.

 NZ
 UK
 US
 AU
 IND

 CA

 Please wait processing your request...