Section1: Company Overview

AB Dynamics PLC (LSE: ABDP) is a FTSE AIM UK 50 Index listed company that specializes in the design, manufacture, and supply of advanced testing, simulation, and measurement products for the global transport industry. Their offerings are primarily utilized in the development of road vehicles, focusing on active safety and autonomous systems, as well as in the automation of vehicles for other sectors like mining and Defense. This Report covers the Investment Highlights, Conclusion, and Recommendation on the stock.

Section2: Financial Highlights

Section 3: Stock Recommendation Summary

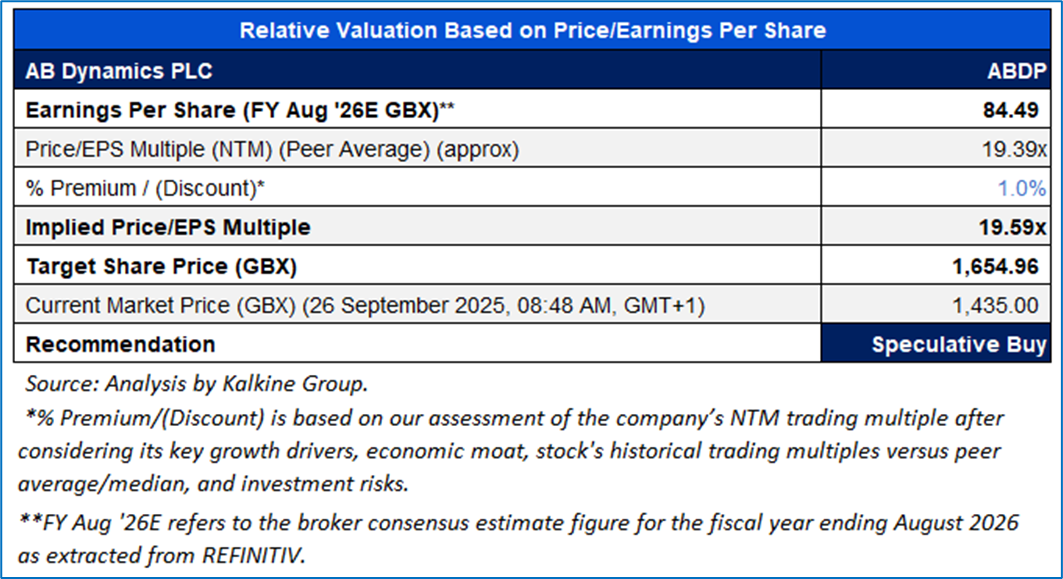
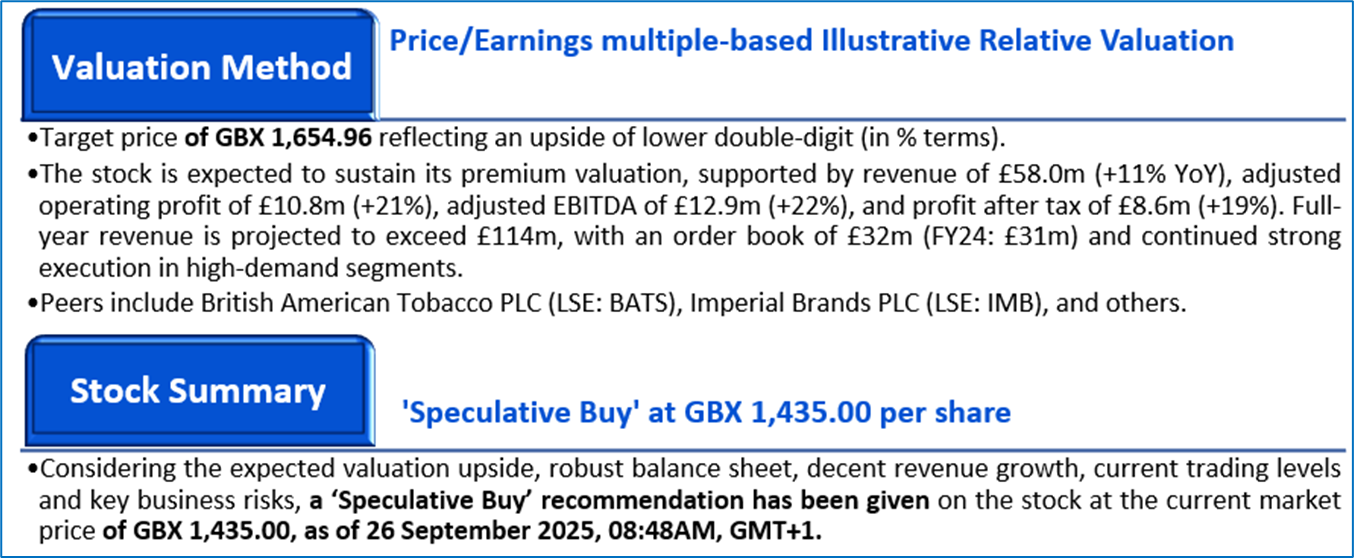
Valuation Methodology: P/E Multiple Based Relative Valuation (Illustrative):

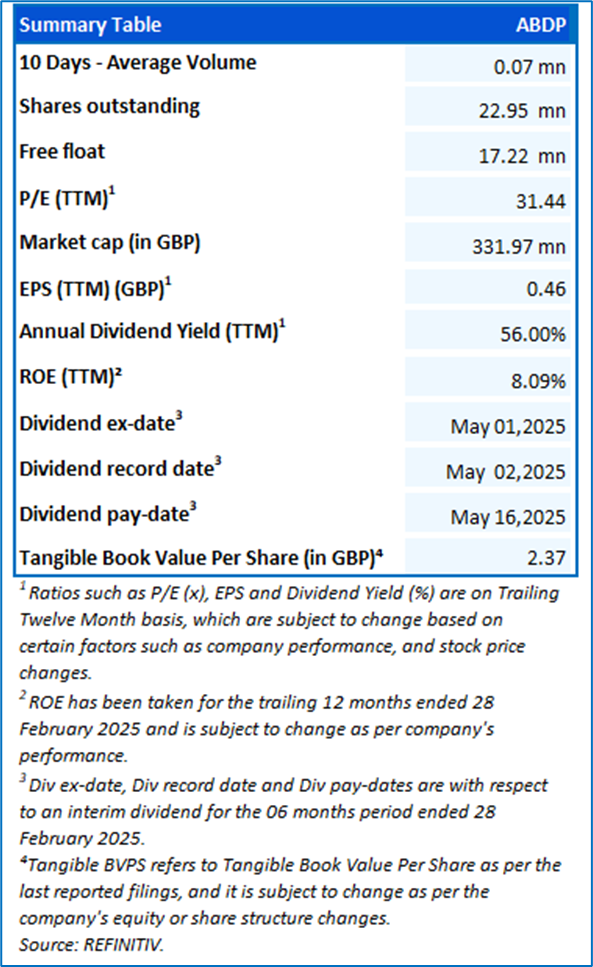
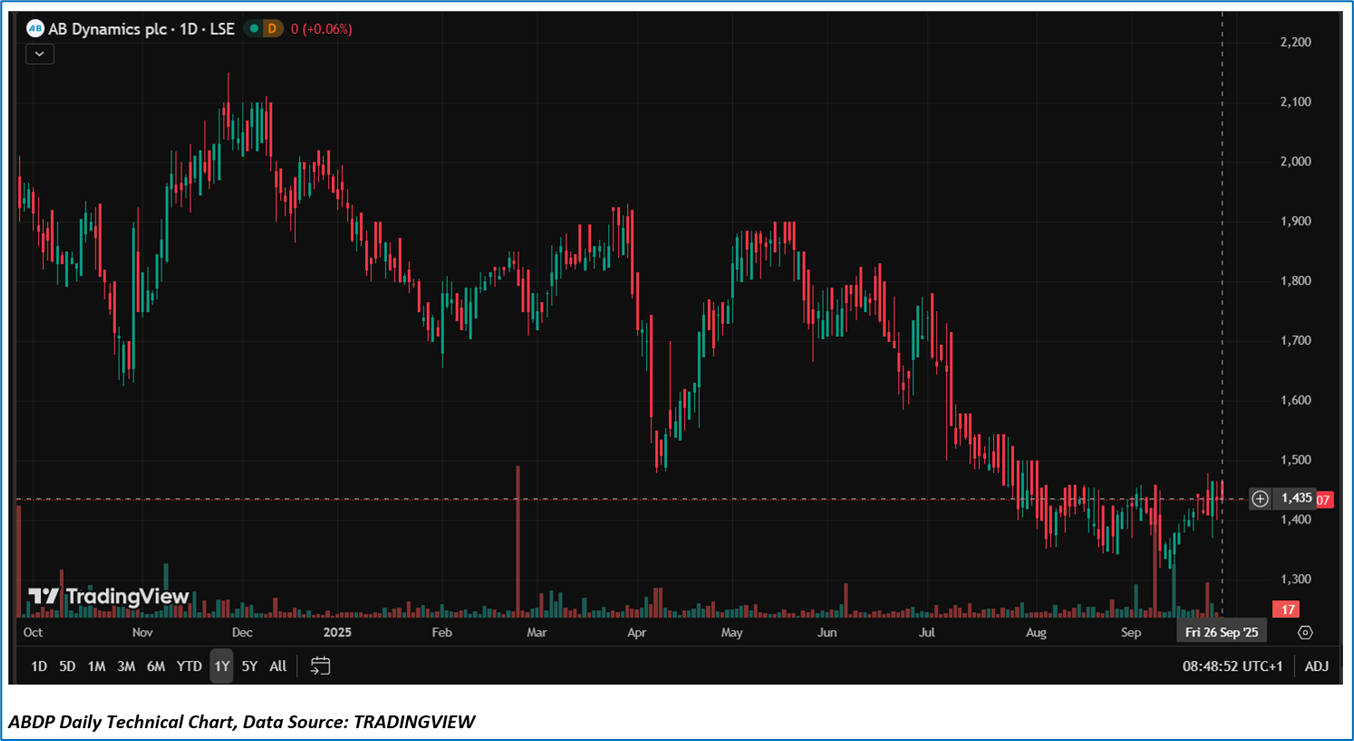
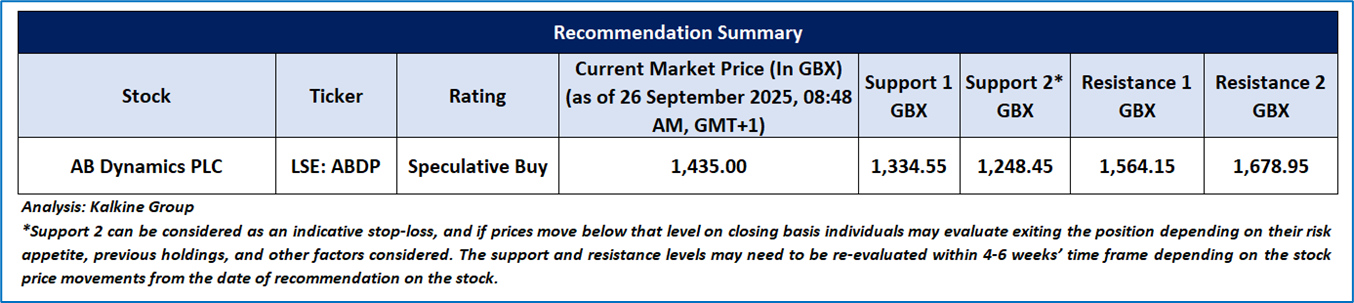
The stock has witnessed a decline of ~17.29 in the last 3 months and over the last 6 months, it has decreased by ~24.07%. The stock has a 52-week low and 52-week high of GBX 1,320.00 & GBX 2,150.00, respectively and is currently trading lower than the average of 52-week high-low.


Note 1: Past performance is not a reliable indicator of future performance.
Note 2: The reference date for all price data, currency, technical indicators, support, and resistance level is 26 September 2025. The reference data in this report has been partly sourced from REFINITIV.
Note 3: Investment decisions should be made depending on an individual's appetite for upside potential, risks, holding duration, and any previous holdings. An 'Exit' from the stock can be considered if the Target Price mentioned as per the Valuation and or the technical levels provided has been achieved and is subject to the factors discussed above.
Note 4: Target Price refers to a price level which the stock is expected to reach as per the relative valuation method and or technical analysis taking into consideration both short-term and long-term scenarios.
Note 5: ‘Kalkine reports are prepared based on the stock prices captured either from the London Stock Exchange (LSE) and or REFINITIV. Typically, both sources (LSE and or REFINITIV) may reflect stock prices with a delay which could be a lag of 15-20 minutes. There can be no assurance that future results or events will be consistent with the information provided in the report. The information is subject to change without any prior notice.
Note 6: Dividend Yield may vary as per the stock price movement.
Technical Indicators Defined: -
Support: A level at which the stock prices tend to find support if they are falling, and a downtrend may take a pause backed by demand or buying interest. Support 1 refers to the nearby support level for the stock and if the price breaches the level, then Support 2 may act as the crucial support level for the stock.
Resistance: A level at which the stock prices tend to find resistance when they are rising, and an uptrend may take a pause due to profit booking or selling interest. Resistance 1 refers to the nearby resistance level for the stock and if the price surpasses the level, then Resistance 2 may act as the crucial resistance level for the stock.
Stop-loss: It is a level to protect further losses in case of unfavourable movement in the stock prices.

 Please wait processing your request...