Company Overview:
American Lithium Corp. (TSXV: LI) is developing two of the world's largest, advanced-stage lithium projects, along with the largest undeveloped uranium project in Latin America. They include the TLC claystone lithium project in Nevada, the Falchani hard rock lithium project and the Macusani uranium deposit, both in southern Peru. All three projects have been through robust preliminary economic assessments, exhibit significant expansion potential and enjoy strong community support.
This Report covers the Price Action, Technical Indicators Analysis along with the Support Levels, Resistance Levels, and Recommendations on this stock.
Fundamental Highlights:
Unlocking Shareholder Value Through a Dedicated Uranium Spin-Out: American Lithium is advancing plans to spin out its Macusani Uranium Project into a standalone public company following the full resolution of all legal matters in Peru. With 100% control of its mining concessions restored and appeals exhausted, the Company is positioned to unlock the intrinsic value of one of the world’s largest undeveloped uranium deposits, offering shareholders direct leverage to a strengthening uranium market.
Leverage to a Strengthening Uranium Cycle with Near-Term Catalysts: Macusani benefits from rising uranium prices, increasing utility contracting, and growing global focus on nuclear fuel security. Ongoing technical de-risking—including an updated Mineral Resource Estimate and Preliminary Economic Assessment by Deloitte and DRA Global—provides clear near-term catalysts, with results expected in Q1 2026, supporting revaluation potential ahead of a possible spin-out.
Key Investment Risks: Commodity Price Volatility, Execution Risk, Permitting & Regulatory Risk, Inflation, etc
LI’s Technical Observation:
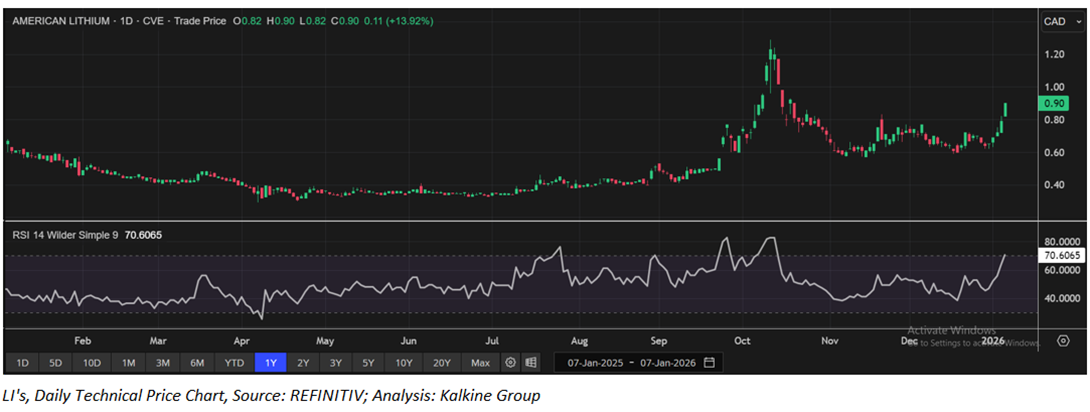
American Lithium’s share price is showing renewed bullish momentum, breaking higher above key moving average support with healthier upside volume. The trend structure has improved, and RSI is pushing into bullish territory, signaling strengthening momentum. The recent breakout suggests potential for continued upside if buying pressure holds.

LI’s Daily Price Chart

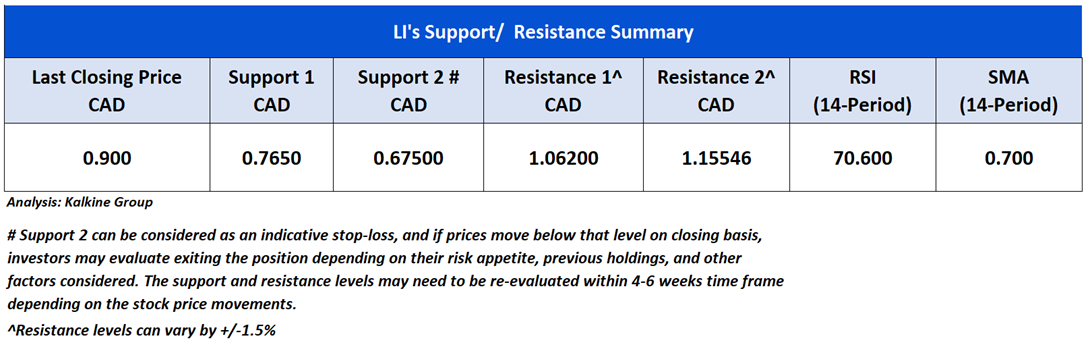
As per the above-mentioned price action and technical indicators analysis, a ‘Speculative Buy’ rating has been given American Lithium Corp. (TSXV: LI) at the closing market price of CAD 0.90, as of 7th January 2026. Individuals can evaluate the stock based on the support and resistance levels provided in the report in case of keen interest taking into consideration the risk-reward scenario.
Markets are trading in a highly volatile zone currently due to certain Macro & Micro-economic data and prevailing geopolitical tensions. Therefore, it is prudent to follow a cautious approach while investing.
Note 1: Past performance is not a reliable indicator of future performance.
Note 2: The reference date for all price data, currency, technical indicators, support, and resistance levels as on January 7, 2026. The reference data in this report has been partly sourced from REFINITIV.
Note 3: Investment decisions should be made depending on an individual's appetite for upside potential, risks, holding duration, and any previous holdings. An 'Exit' from the stock can be considered if the Target Price mentioned as per the Valuation and or the technical levels provided has been achieved and is subject to the factors discussed above.
Note 4: Dividend Yield may vary as per the stock price movement.
Note 5: Kalkine reports are prepared based on the stock prices captured either from REFINITIV or Trading View. Typically, REFINITIV or Trading View may reflect stock prices with a delay which could be a lag of 25-30 minutes. There can be no assurance that future results or events will be consistent with the information provided in the report. The information is subject to change without any prior notice.
Technical Indicators Defined: -
Support: A level at which the stock prices tend to find support if they are falling, and a downtrend may take a pause backed by demand or buying interest.
Resistance: A level at which the stock prices tend to find resistance when they are rising, and the uptrend may take a pause due to profit booking or selling interest.
Stop-loss: In general, it is a level to protect further losses in case of any unfavourable movement in the stock prices.

 NZ
 UK
 US
 AU
 IND

 CA

 Please wait processing your request...