Ormat Technologies, Inc.
ORA Details
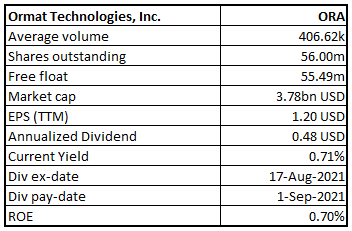
Ormat Technologies, Inc. (NYSE: ORA) is engaged in the business of providing renewable power and energy solutions to its customers globally. It provides clean, reliable energy solutions which it generates from geothermal and recovered energy. It also provides energy management and storage solutions.
Q2FY21 Results Highlights (For the Period Ended 30 June 2021)
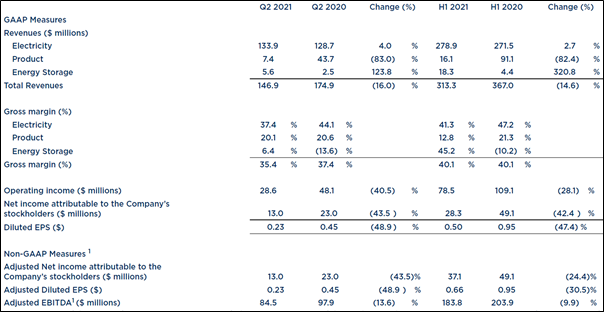
- Decrease in Revenue: Overall revenue declined by 16.0% YoY to $146.9 million mainly due to lower product segment revenue, down by 83.0% YoY to $7.4 million primarily impacted by COVID-19. This fall offsets the growth in both electricity and energy storage segments by 4% YoY and 123.8% YoY, respectively.
- Net Income at $13.0 million: The company logged a decline in its net income attributable to stockholders to $13.0 million, down 43.5% YoY, primarily due to lower revenue in the product segment and lower gross profit at the electricity segment.
Key Data (Source: Company Reports)
Recent Updates
- As per the release dated 10 August 2021, the company has signed a Long-Term Resource Adequacy agreement with Pacific Gas and Electric Company (PG&E) for its 20MW/40MWh Pomona-2 facility, which is currently under construction.
Outlook
Guidance for FY21: ORA is expecting to achieve revenue in the range of $650-$685 million in FY21, driven by Electricity segment revenue between $585-$595 million, Product segment revenue between $40-$60 million, Energy Storage revenue between $25-$30 million. Further, the company plans to achieve an adjusted EBITDA in the range of $400-$410 million in FY21.
On Track to Increase its Portfolio to Around 1.5 GW by 2023: The company is going as per the plan of increasing overall geothermal, energy storage, and solar generating portfolio to ~1.5GW by 2023 driven by the recent completion of the expansion of the McGinness Hills coupled with the inclusion of the recently acquired Dixie Valley and Beowawe assets, and its internal growth.
Key Risks
The company’s global operations are exposed to risks like foreign laws and regulations along with geopolitical risk, and acts of terrorism. Besides, a sustained drop in product backlog would impact its target of full utilization of the production and manufacturing facilities.
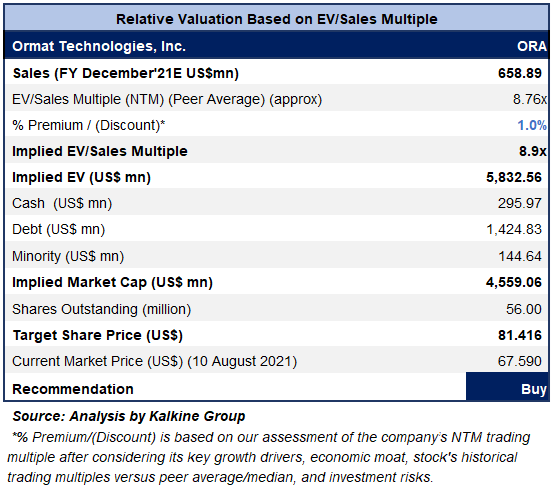
Valuation Methodology: EV/Sales Based Relative Valuation (Illustrative)
Technical Overview:
Chart:
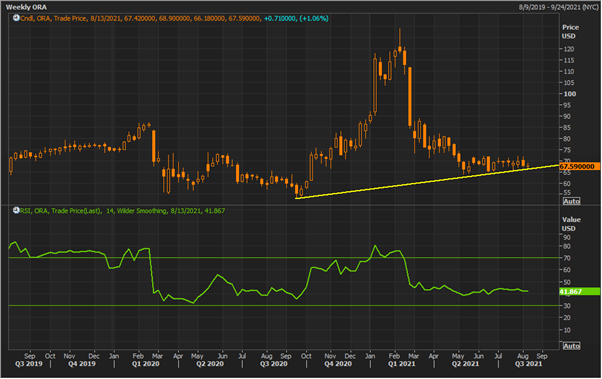
Source: REFINITIV
Note: Purple Color Line Reflects RSI (14-Period)
Stock Recommendation
ORA has delivered 9-month and one-year returns of ~-12.7% and ~+11.10%, respectively. The stock is trading lower than the average of the 52-week high price of $128.87 and the 52-week low price of $53.44, which indicates a good opportunity for accumulation.
We have valued the stock using an EV/Sales multiple-based illustrative relative valuation and have arrived at a target price that reflects a rise of low double-digit (in % terms). We have assigned a slight premium to EV/Sales Multiple (NTM) (Peer Average), considering the significant increase in product segment backlog that grew by 59% to $59.1 million as of 4 August 2021 as well as strong sales pipeline and sustained growth in its energy storage and electricity segments.
For the purpose of relative valuation, we have taken peers like Montauk Renewables Inc. (MNTK.OQ), Nextera Energy Partners LP. (NEP.N), and Brookfield Renewable Corp. (BEPC.N) to name a few.
Considering the aforementioned factors, and strong outlook, we give a “Buy” recommendation on the stock at the current market price of $67.59 per share, up by 1.06% on 10th August 2021.
Sunrun Inc.
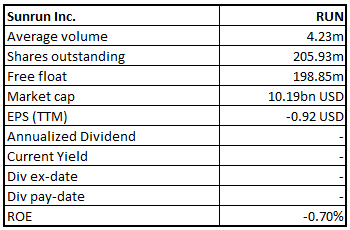
RUN Details
Sunrun Inc. (NASDAQ: RUN) is the top solar player in the U.S with focus on residential solar systems. It provides home solar, battery storage, and energy services to its customers present across 175 cities in 22 states and Puerto Rico.
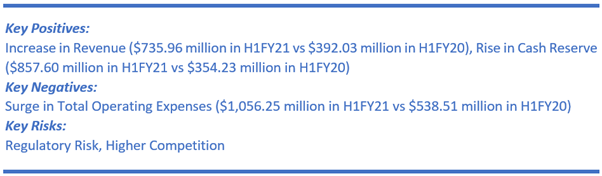
H1FY21 Results Performance (For the Period Ended 30 June 2021)
- Solid Revenue growth of 87.73% YoY: RUN has logged a strong revenue growth of 87.73% YoY to $735.96 million with revenue from customer agreements and incentives as well as solar energy systems and product sales grew by 92% and 83%, respectively. Net subscriber value stood at $5,574 in Q2FY21 and the generation of the total value was $122 million during Q2FY21.
- Customer Additions: Customer additions remained healthy as it added 26,110 customers, including 21,894 subscriber additions that take its customer base to 599,743 as of 30 June 2021.
- Increase in Net Loss: Total operating expenses increased significantly by 96.14% YoY to $1,056.25 million. Resultantly, net loss attributable to common stockholders increased to $65.03 million from $41.52 million in the PCP.
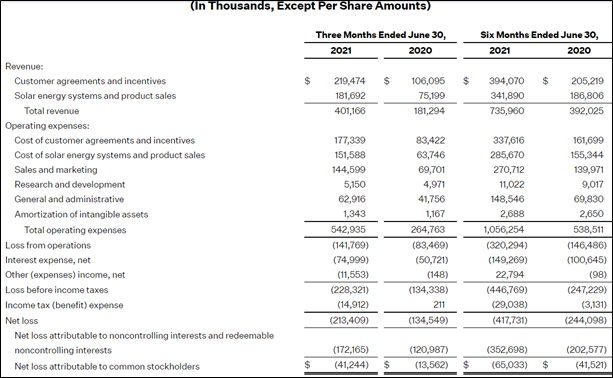
Consolidated Income Statement (Source: Company Reports)
Recent Update
- Appointment of CEO: As per the press release dated 5 August 2021, the company announced that Mary Powell, a Sunrun Director, and former President and CEO of Green Mountain Power, to take over the charge of the company’s next Chief Executive Officer, effective August 31, 2021.
Outlook
The company highlighted that it is progressing as per the plan to deliver a break-out year. Resultantly, the management raised its growth guidance in solar energy capacity installed to 30% from its earlier prediction of 25-30% growth for 2021.
Further, the company expects to achieve a total value generated between $700-750 million in 2021 against its earlier guidance of over $750 million mainly due to the adjustments pertaining to the effects of accelerating growth and timing of cost recognition. The company anticipates cost synergies from the acquisition of Vivint Solar to the tune of ~$120 million in run-rate synergies by the end of 2021.
Key Risks
The company’s operations are exposed to risks like the impact of COVID-19 on its business and operations as well as the effective integration of Vivint Solar, fluctuations in the electricity production retail prices, changes in regulations and policies, among others.
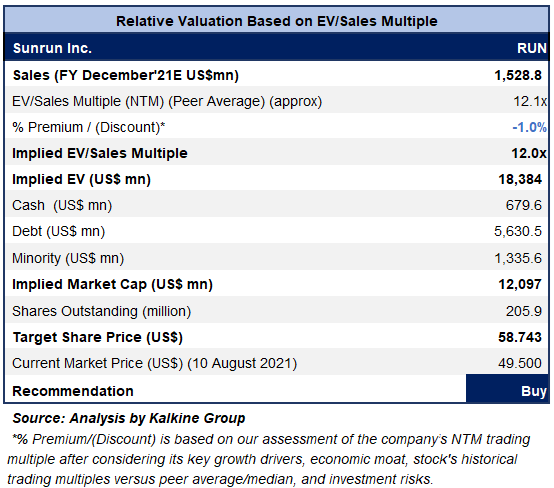
Valuation Methodology: EV/Sales Based Relative Valuation (Illustrative)
Technical Overview:
Chart:
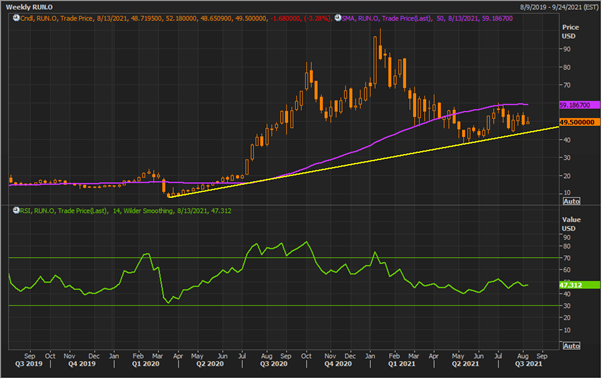
Source: REFINITIV
Note: Purple Color Line Reflects RSI (14-Period)
Stock Recommendation
RUN has delivered 3-month and one year returns of ~+15.3% and ~+4.7%, respectively. The stock is trading lower than the average of the 52-week high price of $100.93 and the 52-week low price of $37.42, which indicates a good opportunity for accumulation.
We have valued the stock using an EV/Sales multiple-based illustrative relative valuation and have arrived at a target price that reflects a rise of low double-digit (in % terms). We have applied a slight discount to EV/Sales Multiple (NTM) (Peer Average) considering higher operating costs, negative earnings in Q2FY21 as well as higher debt levels.
For the purpose of relative valuation, we have taken peers like Advent Technologies Holdings Inc. (ADN.OQ), Vicor Corp. (VICR.OQ), and Beam Global. (BEEM.OQ), among others.
Considering its acceleration in sales volumes to new records in Q2FY21 along with record installation in Q2FY21, upgrade in guidance, and decent growth outlook, we give a “Buy” recommendation on the stock at the current market price of US$49.500, down by 3.28% on 10th August 2021.
Note 1: The reference data in this report has been partly sourced from REFINITIV.
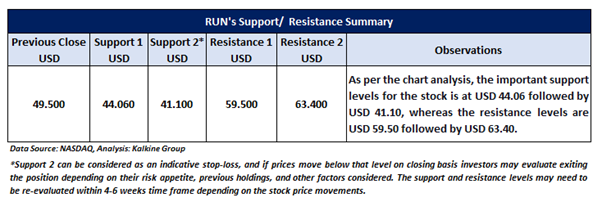
Note 2: Investment decisions should be made depending on the investors’ appetite on upside potential, risks, holding duration, and any previous holdings. Investors can consider exiting from the stock if the Target Price mentioned as per the analysis has been achieved and subject to the factors discussed above alongside support levels provided.
Technical Indicators Defined:-
Support: A level where-in the stock prices tend to find support if they are falling, and downtrend may take a pause backed by demand or buying interest.
Resistance: A level where-in the stock prices tend to find resistance when they are rising, and uptrend may take a pause due to profit booking or selling interest.
Stop-loss: It is a level to protect further losses in case of unfavourable movement in the stock prices.
Disclaimer
The advice given by Kalkine Canada Advisory Services Inc. and provided on this website is general information only and it does not take into account your investment objectives, financial situation and the particular needs of any particular person. You should therefore consider whether the advice is appropriate to your investment objectives, financial situation and needs before acting upon it. You should seek advice from a financial adviser, stockbroker or other professional (including taxation and legal advice) as necessary before acting on any advice. Not all investments are appropriate for all people. The website www.kalkine.ca is published by Kalkine Canada Advisory Services Inc. The link to our Terms & Conditions has been provided please go through them. On the date of publishing this report (mentioned on the website), employees and/or associates of Kalkine do not hold positions in any of the stocks covered on the website. These stocks can change any time and readers of the reports should not consider these stocks as advice or recommendations later.

 Please wait processing your request...