Clearway Energy Inc
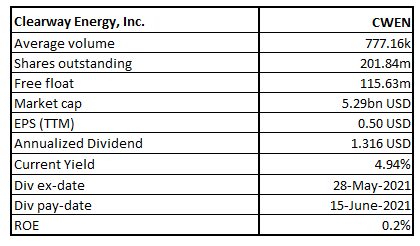
CWEN Details
Clearway Energy Inc (NYSE: CWEN) is one of the major renewable energy players in the US. It has more than 4,200 net MW of installed wind and solar generation projects.
Q1FY21 Results Performance (For the Period Ended 31 March 2021)
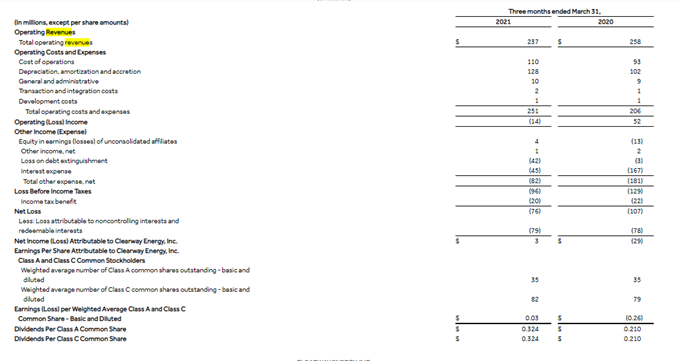
Lower Revenue: Total Operating revenue during the period has reduced to $237 million from $258 million in Q1FY20.
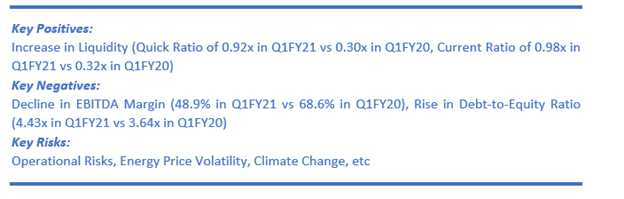
Texas Winter Event Weighed on EBITDA: Adjusted EBITDA declined to $198 million from $225 million in PCP reflecting the impact of the Texas winter event, partially offset by growth investments and robust renewable production on the West coast of the United States.
Reduction in Net Loss: Net Loss, however, reduced to $76 million supported by the non-cash change in the fair value of interest rate swaps.
Outlook
Funds Raised to Support Growth: The successful raising of $925 million of corporate capital through the issuance of new green bonds due in 2031 at an attractive cost has resulted in reducing its cash interest costs by refinancing the $600 million 2025 senior notes. This has also provided further capital to finance growth. The company has overall liquidity of $831 million as of 31 March 2021.
Broadening Presence through Acquisition: The completion of the acquisition of the 264 MW Mt. Storm-wind project in West Virginia is aiding the company in further diversifying its geographic presence.
Growth Target: CWEN has raised the quarterly dividend for Q2FY21 by 1.5% to $0.329 per share and it is going as per plan to achieve the upper end of the annual growth rate target of 5-8% by the end of 2021.
Key Risks
The company’s operations are exposed to substantial governmental regulation, including environmental laws. Any changes in laws or regulations would hamper its electric generation business. Further, its generation of renewable energy is highly reliant on suitable meteorological conditions. Any severe weather conditions would have an adverse impact on its revenue.
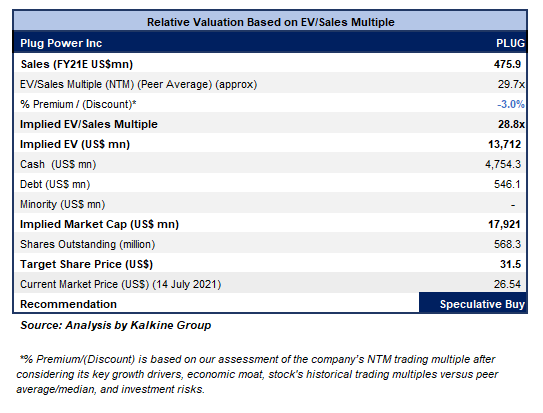
Valuation Methodology: EV/Sales Based Relative Valuation (Illustrative)

Technical Overview:
Weekly Chart –
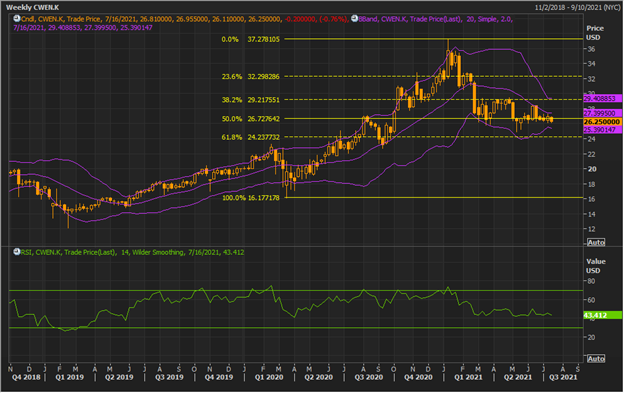
Source: REFINITIV
Note: Purple colour lines are Bollinger Bands® with the upper band suggesting overbought status while the lower band oversold status, and yellow lines are Fibonacci retracement lines which measure price rebound and backtrack. https://www.bollingerbands.com/
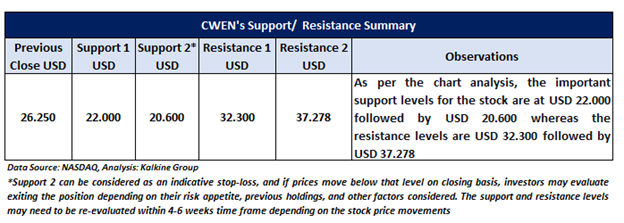
Having corrected close to the 61.8% retracement level of $24.24 level, the stock for few weeks has been hovering around the 50% retracement level of $26.72. It has given a softer close for the ongoing week at $26.25. The technical indicator RSI with a reading around 43, suggests neutral momentum for the stock.
Going forward, the stock may have resistance around the level of $32.300 whereas support could be around the level of $22.000.
Stock Recommendation
We have valued the stock using an EV/Sales multiple-based illustrative relative valuation and have arrived at a target price that reflects a rise of low double-digit (in % terms). We have assigned a slight premium to EV/Sales Multiple (NTM) (Peer Average) considering the benefits of its healthy balance sheet and improved cash available for distribution (CAFD) outlook. Due to the benefit of lower interest expense on the back of refinancing of the 2025 senior notes, the company has increased its pro forma CAFD outlook to $395 million. This further provides visibility on the continued long-term dividend growth of the company.
For the purposes of relative valuation, we have taken peers like Brookfield Renewable Corp (BEPC.N), Nextera Energy Partners LP (NEP.N), to name a few.
Considering the aforementioned factors and decent outlook, we give a “Buy” recommendation on the stock at the current market price of $26.25 per share, down by 0.76% on 14th July 2021.
Plug Power, Inc.
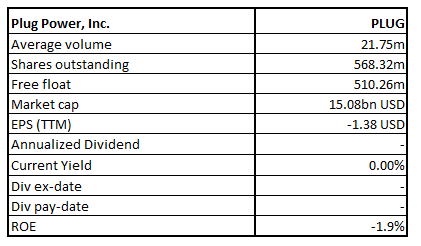
PLUG Details
Plug Power, Inc. (NASDAQ: PLUG) is a provider of comprehensive hydrogen fuel cell turnkey solutions. The company has a market capitalization of ~US$15.08 billion as on 14th July 2021.
Q1FY21 Update:
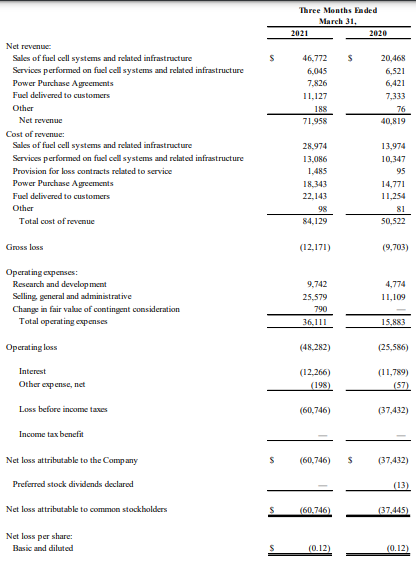
The company shipped 1,308 GenDrive units and had revenue associated with six hydrogen infrastructure systems in the first quarter of FY 2021. Net revenue stood at $72.0 million compared to $40.8 million in Q1 FY 2020. Gross billings were $73.7 million this quarter as compared to $43.0 million for the first quarter of 2020.
During the period, fuel gross margins were negatively impacted, reflecting costs associated with transitioning from one specific industrial gas company to another due to its escalation of rates over the last several quarters.
Key Data (Source: Company Reports)
Result Performance (Year Ended 31 December 2020 – FY20)
On 31st December 2020, the company waived the remaining vesting conditions under the warrant which was issued to Amazon.com NV investment holdings LLC, which is the wholly owned subsidiary of Amazon.com Inc., in April 2017, that resulted in the reduction to revenue of $399.7 Mn, resulting in negative consolidated revenue of $93.2 Mn for the year ended December 31, 2020.
PLUG reported net losses attributable to common stockholders of ~$596.2 million in 2020 versus $85.6 million in FY19.
Outlook:
The company experienced higher than normal professional service expenses which is expected to continue into Q2FY21 but will abate in Q3FY21. The company is focused towards building the green hydrogen economy on the global basis. Immediately after the close of 2020, it has announced several strategic partnerships, expanding as well as solidifying the global presence.
Key Risks:
The company’s products as well as performance depend mainly on the availability of hydrogen gas as well as an insufficient supply of hydrogen could adversely affect the company’s sales as well as deployment of the products and services.
Valuation Methodology: EV/Sales Multiple Based Relative Valuation (Illustrative)
Technical Overview:
Weekly Chart:
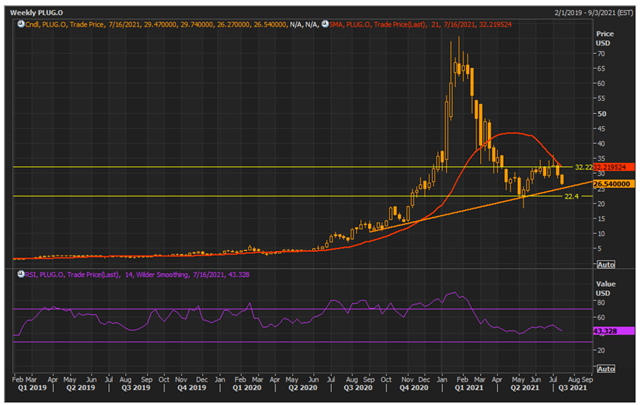
Source: REFINITIV
Note: The orange color line in the charts represents a trend line while the purple color line shows RSI (14-period). The red color line represents 21-period SMA.
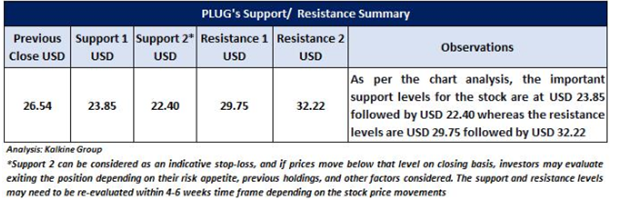
PLUG's prices are sustaining above an upward sloping trend line and currently trading around the trend line support level US$25.20, indicating the possibility of an upside reversal from the level. The momentum indicator RSI (14-period) is trading at ~43.33 levels. Now a major resistance level for the stock appears at US$32.22 levels whereas support is at US$22.40 level.
Stock Recommendation:
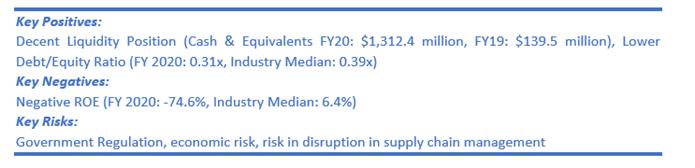
The company’s current ratio for FY20 stood at 7.21x, better than the industry median of 2.33x, implying that the company possesses better capabilities to meet its short-term obligations than its peer group. Its Debt to Equity ratio for FY20 stood at 0.31x, lower than the industry median of 0.39x, depicting reasonable leverage position of the company.
We have valued the stock using EV/Sales multiple-based illustrative relative valuation method and have arrived at a target price which reflects a rise of low double-digit (in % terms). We applied a discount to the peer average EV/Sales (NTM Trading multiple) considering negative ROE as well as the risks associated. Also, the volatility in the commodity prices as well as product shortages could significantly impact the company’s gross margins.
Considering the aforesaid facts, we give a “Speculative Buy” recommendation on the stock at the current price of NZ$26.54 per share, down by 4.6% on 14th July 2021.
Note 1: The reference data in this report has been partly sourced from REFINITIV.
Note 2: Investment decisions should be made depending on the investors’ appetite on upside potential, risks, holding duration, and any previous holdings. Investors can consider exiting from the stock if the Target Price mentioned as per the analysis has been achieved and subject to the factors discussed above alongside support levels provided.
Technical Indicators Defined:-
Support: A level where-in the stock prices tend to find support if they are falling, and downtrend may take a pause backed by demand or buying interest.
Resistance: A level where-in the stock prices tend to find resistance when they are rising, and uptrend may take a pause due to profit booking or selling interest.
Disclaimer
The advice given by Kalkine Canada Advisory Services Inc. and provided on this website is general information only and it does not take into account your investment objectives, financial situation and the particular needs of any particular person. You should therefore consider whether the advice is appropriate to your investment objectives, financial situation and needs before acting upon it. You should seek advice from a financial adviser, stockbroker or other professional (including taxation and legal advice) as necessary before acting on any advice. Not all investments are appropriate for all people. The website www.kalkine.ca is published by Kalkine Canada Advisory Services Inc. The link to our Terms & Conditions has been provided please go through them. On the date of publishing this report (mentioned on the website), employees and/or associates of Kalkine do not hold positions in any of the stocks covered on the website. These stocks can change any time and readers of the reports should not consider these stocks as advice or recommendations later.

 Please wait processing your request...