
Aurora Solar Technologies (TSXV: ACU) is a leader in the development and delivery of inline process measurement analysis and control systems for solar cell manufacturers. We believe that solar power will dominate the renewable energy field and our mission is to bring quality and profitability to every customer through superior control of critical processes during solar cell manufacturing.
This Report covers the Price Action, Technical Indicators Analysis along with the Support Levels, Resistance Levels, and Recommendations on this stock.

- Global Recognition Strengthens Technology Credibility: BT Imaging’s Intelligent PL platform won three major awards at SNEC 2025, one of the world’s largest solar industry events. This recognition enhances brand credibility and validates the company’s innovation leadership. Industry awards often accelerate customer trust and shorten adoption cycles. It also positions Aurora as a key metrology provider for next-generation solar manufacturing.
- First-Mover Advantage in Contactless IV Measurement: The company introduced the first truly inline contactless IV measurement system. This technology addresses metrology challenges for advanced solar cells such as TOPCon, heterojunction, and tandem cells. Traditional contact-based tools limit throughput and flexibility, creating a decent need for Aurora’s solution. Early leadership in this niche can create durable competitive advantages.

- Early Commercialization Stage: The platform is still in early commercialization, and large-scale orders are not yet confirmed. Revenue visibility remains limited until firm contracts are secured.
- Customer Concentration Risk: Initial sales may depend on a few major solar manufacturers. Any delay in adoption or qualification could impact growth.
- Thin liquidity and lower volumes: Thin trading volumes and limited liquidity can lead to sharp price swings and make it difficult for investors to enter or exit positions at desired levels.

ACU is stabilising near the CAD 0.005 support level after a prolonged decline, with price action showing tight consolidation and reduced selling pressure. The sideways movement suggests a potential base-building phase. RSI around 42.22 reflects weak but steady momentum. A sustained breakout above CAD 0.01 could trigger a bullish reversal and attract fresh buying interest.
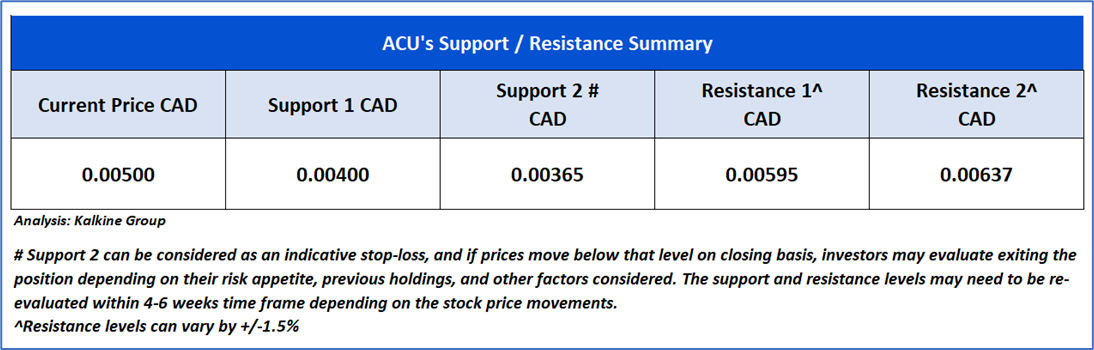


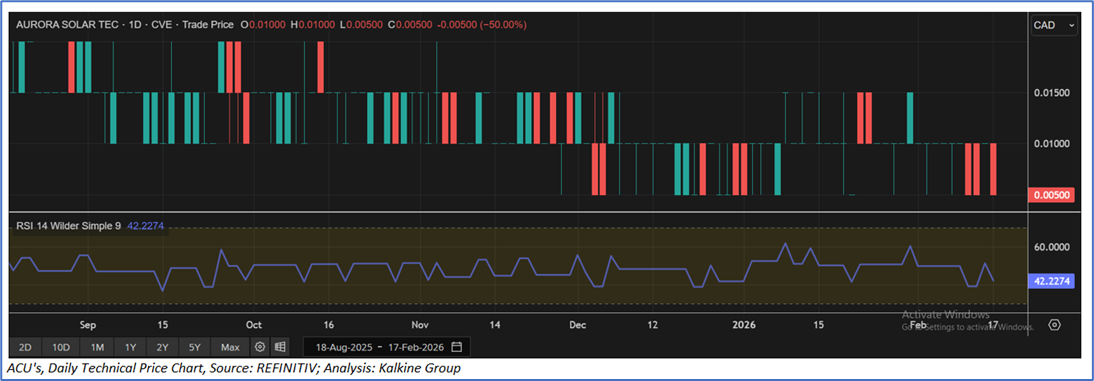

As per the above-mentioned price action and technical indicators analysis, a ‘Speculative Buy’ rating has been given Aurora Solar Technologies (TSXV: ACU) at the closing market price of CAD 0.050, as of February 17, 2026.
Individuals can evaluate the stock based on the support and resistance levels provided in the report in case of keen interest taking into consideration the risk-reward scenario.
Markets are trading in a highly volatile zone currently due to certain Macro & Micro-economic data and prevailing geopolitical tensions. Therefore, it is prudent to follow a cautious approach while investing.
Note 1: Past performance is not a reliable indicator of future performance.
Note 2: Investment decisions should be made depending on an individual’s appetite for upside potential, risks, and any previous holdings. This recommendation is purely based on technical analysis, and fundamental analysis has not been considered in this report. Individuals can consider exiting from the stock if the Target Price or Stop loss mentioned as per the technical analysis has been achieved and is subject to the factors discussed above.
Note 3: Related Risks: This report may be looked at from a high-risk perspective and recommendations are provided for a short duration. Recommendations provided in this report are solely based on technical parameters, and the fundamental performance of the stocks has not been considered in the decision-making process. Other factors which could impact the stock prices include market risks, regulatory risks, interest rate risks, currency risks, social and political instability risks etc.
Note 4: How to Read the Charts?
The Yellow color line reflects the 20-period moving average. SMA helps to identify existing price trends. If the prices are trading above the 20-period moving average, then it shows prices are currently trading in a bullish trend.
The Purple color line in the chart’s lower segment reflects the Relative Strength Index (14-Period) which indicates price momentum and signals momentum in trend. A reading of 70 or above suggests overbought status while a reading of 30 or below suggests an oversold status.
The Ink Blue color lines are the trend lines drawn by connecting two or more price points and used for trend identification purposes. The trend line also acts as a line of support and resistance.
Technical Indicators Defined: -
Support: A level at which the stock prices tend to find support if they are falling, and a downtrend may take a pause backed by demand or buying interest. Support 1 refers to the nearby support level for the stock and if the price breaches the level, then Support 2 may act as the crucial support level for the stock.
Resistance: A level at which stock prices tend to find resistance when they are rising, and an uptrend may take a pause due to profit booking or selling interest. Resistance 1 refers to the nearby resistance level for the stock and if the price surpasses the level, then Resistance 2 may act as the crucial resistance level for the stock.
Stop-loss: It is a level to protect against further losses in case of unfavorable movement in the stock prices.
The reference date for all price data, currency, technical indicators, support, and resistance levels is February 17, 2026. The reference data in this report has been partly sourced from REFINITIV.
Abbreviations
CMP: Current Market Price
SMA: Simple Moving Averages
CAD: Canadian Dollar
RSI: Relative Strength Index
USD: United States dollar
Note: Trading decisions require a thorough analysis by individuals. Technical reports in general chart out metrics that may be assessed by individuals before any stock evaluation. The above are illustrative analytical factors used for evaluating stocks; other parameters can be looked at along with additional risks per se. Past performance is neither an indicator nor a guarantee of future performance.

 NZ
 UK
 US
 AU
 IND

 CA

 Please wait processing your request...