REA Group Limited
REA Business Details
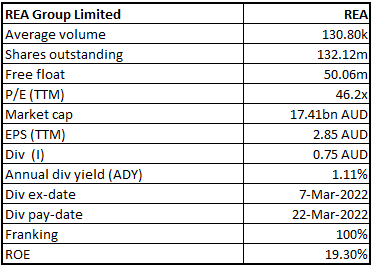
REA Group Limited (ASX: REA) is a leading global digital advertising business specializing in property with more than 2,800 people working across three continents. REA Group runs Australia’s leading residential and commercial property websites, namely, realestate.com.au and realcommercial.com.au.
H1FY22 Result Performance (For the Period Ended 31 December 2021)
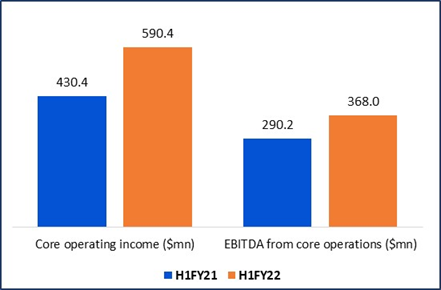
- The group has recorded 37% YoY growth in operating income from core operations to $590.4 million in FY21. It includes the consolidation of the REA India from 1 January 2021 and Mortgage Choice from 1 July 2021.
- EBITDA from the group's core operations increased by 27% YoY to $368.0 million, and net profit from core operations attributable to owners of the parent improved by 31% YoY to $225.8 million.
- The Board has determined to pay an interim dividend of 75.0 cents per share fully franked that showed an increase of 27% YoY.
Source: Company Reports, Analysis by Kalkine Group
Key Update
On 7 February 2022, form 10-Q was filed by News Corp with SEC. In H1FY22, REA completed a debt refinancing of the outstanding amount under its 2021 Bridge facility through the proceeds of A$600 million unsecured syndicated credit facility.
Outlook
The Group generated positive operating cashflows and traded profitably for the half-year ended 31 December 2021. The directors expect this to continue for the near future. The Group strengthened its liquidity position by entering a new syndicated facility, replacing the previous facility. Further, the company highlighted that residential property market conditions remain favourable, with high levels of buyer enquiry reinforced by improved supply. The company expects the YoY growth rates to slow in the second half. FY22 operating cost growth is expected to be of low-double digits, against its earlier expectation of high single digits growth, reflecting an increase in revenue-related variable costs.
Key Risks
REA operates in a highly competitive market. Its business model could be impacted by developing new technologies and higher competition from existing or new sites and apps. Further, its group business activities, particularly the real estate listings and financial services, are extremely reliant on the exposure to macroeconomic, regulatory, legal, and geopolitical conditions across its operating markets viz, Australia, India, and Asia.
Valuation Methodology: Price/Earnings Per Share Based Relative Valuation (Illustrative)
Technical Overview:
Daily Price Chart
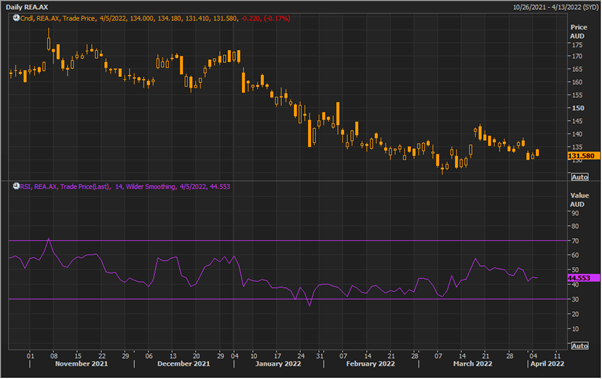
Source: REFINITIV, Note: Purple color line reflects Relative Strength Index (14-Period)
Stock Recommendation
The stock is trading lower than the average of the 52-week high price of $180.67 and the 52-week low price of $124.51.
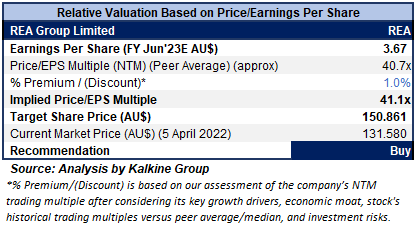
The stock has been valued using a P/E multiple-based illustrative relative valuation, and the target price so arrived reflects a rise of low double-digit (in % terms). A slight premium has been applied to P/E Multiple (NTM) (Peer Average), considering strong result performance in H1FY22, its growth strategies, and pivotal investments to drive growth in rest of 2022.
Considering the aforementioned factors along with decent outlook and liquidity position, we give a “Buy” recommendation on the stock at the current market price of A$131.58 per share as of 5th April 2022 (Time: 10:58 AM (GMT+10), Sydney, Australia).
Markets are trading in a highly volatile zone currently due to certain macro-economic issues and geopolitical tensions prevailing. Therefore, it is prudent to follow a cautious approach while investing.
REA Group Limited (REA) is a part of Kalkine’s Global Big Money Product
Note 1: The reference data in this report has been partly sourced from REFINITIV.
Note 2: Investment decisions should be made depending on the investors’ appetite on upside potential, risks, holding duration, and any previous holdings. Investors can consider exiting from the stock if the Target Price mentioned as per the analysis has been achieved and subject to the factors discussed above alongside support levels provided.
Technical Indicators Defined:-
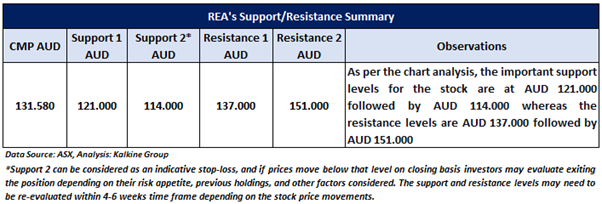
Support: A level where-in the stock prices tend to find support if they are falling, and downtrend may take a pause backed by demand or buying interest.
Resistance: A level where-in the stock prices tend to find resistance when they are rising, and uptrend may take a pause due to profit booking or selling interest.
Stop-loss: It is a level to protect further losses in case of unfavourable movement in the stock prices.
Disclaimer
The advice given by Kalkine Canada Advisory Services Inc. and provided on this website is general information only and it does not take into account your investment objectives, financial situation and the particular needs of any particular person. You should therefore consider whether the advice is appropriate to your investment objectives, financial situation and needs before acting upon it. You should seek advice from a financial adviser, stockbroker or other professional (including taxation and legal advice) as necessary before acting on any advice. Not all investments are appropriate for all people. The website www.kalkine.ca is published by Kalkine Canada Advisory Services Inc. The link to our Terms & Conditions has been provided please go through them. On the date of publishing this report (mentioned on the website), employees and/or associates of Kalkine do not hold positions in any of the stocks covered on the website. These stocks can change any time and readers of the reports should not consider these stocks as advice or recommendations later.

 Please wait processing your request...