
First Growth Funds Limited (CSE: FGFL) provides Advisory Services to companies and invests across a diversified portfolio of different asset classes, including equity and convertible note investments in large and small cap public listed and private companies. The Company also invests in technology companies involved in the development of blockchain solutions as well as direct investments in established and liquid Cryptocurrency (for example Bitcoin and Ethereum).
This Report covers the Price Action, Technical Indicators Analysis along with the Support Levels, Resistance Levels, and Recommendations on this stock.

- High Exposure to Unlisted Investments (Early-Stage Upside): ~94% of financial assets are in unlisted securities (~AUD 2.0 mn), offering exposure to early-stage or private opportunities. These assets typically carry higher return potential versus listed equities. Successful exits or re-ratings could significantly uplift valuation. However, this comes with valuation opacity.
- Improving Investment Income Profile: Interest income and realized gains contributed positively alongside fair value changes. This shows gradual diversification of income streams. Over time, recurring income could reduce reliance on valuation gains. This would improve earnings quality.
- Low Debt Burden and Limited Financial Leverage: The company operates with minimal traditional debt. Liabilities are largely trade payables and related-party loans. This reduces financial risk from interest obligations. Capital structure remains flexible for future fundraising.

- Earnings Quality Concerns: Profitability is driven largely by unrealised fair value gains rather than cash earnings. This reduces reliability and repeatability.
- Liquidity Risk in Investments: Unlisted securities may not be easily monetised. Forced sales could occur at discounts, impacting realised returns.
- Concentration Risk: Large portion of gains driven by a few investments (e.g., NANT Global Finance). Underperformance in key holdings could materially impact results.
- Low Liquidity Risk: Low trading volume may make it difficult to buy or sell shares quickly and could lead to higher price volatility.

FGFL is trading around CAD 0.020 and has shown a gradual upward drift following a prolonged low-liquidity base formation. The price action indicates intermittent buying interest with higher prints toward the CAD 0.030 zone, suggesting early-stage accumulation despite thin volumes. The RSI near 47.06 reflects neutral momentum, indicating neither overbought nor oversold conditions, but a stabilising trend. A sustained move above CAD 0.030 could signal renewed bullish momentum and attract incremental participation, while failure to hold CAD 0.015 - 0.020 may lead to continued sideways consolidation.
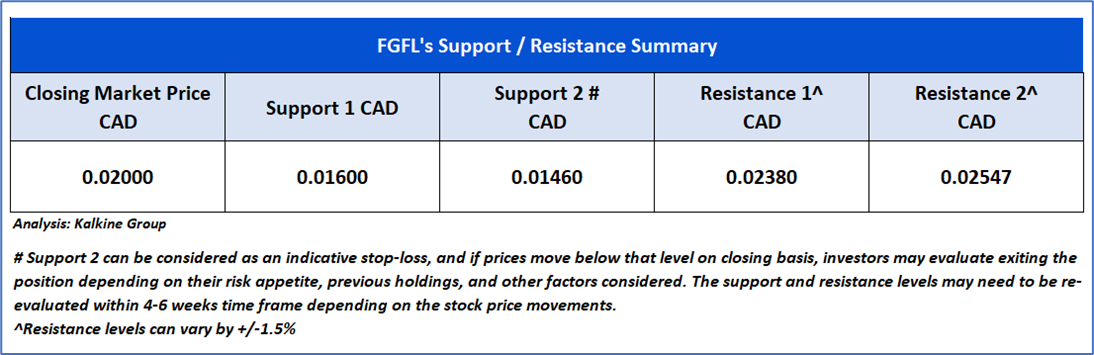


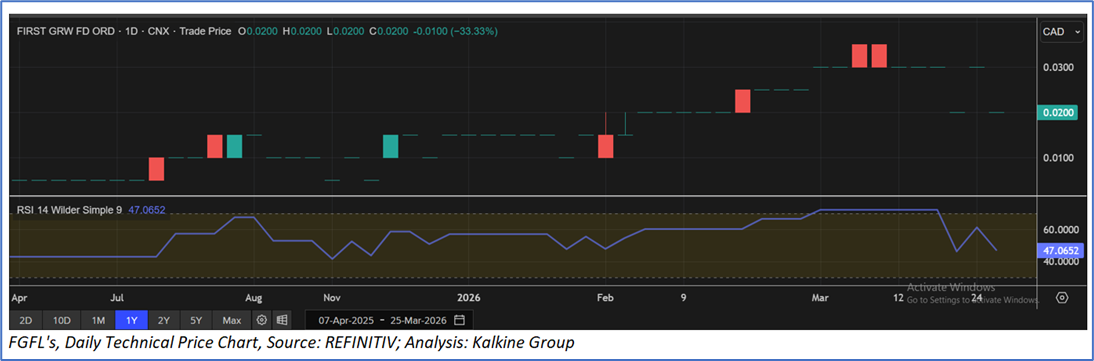

As per the above-mentioned price action and technical indicators analysis, a ‘Speculative Buy’ rating has been given First Growth Funds Limited (CSE: FGFL) at the closing market price of CAD 0.020, as of March 25, 2026.
Individuals can evaluate the stock based on the support and resistance levels provided in the report in case of keen interest taking into consideration the risk-reward scenario.
Markets are trading in a highly volatile zone currently due to certain Macro & Micro-economic data and prevailing geopolitical tensions. Therefore, it is prudent to follow a cautious approach while investing.
Note 1: Past performance is not a reliable indicator of future performance.
Note 2: Investment decisions should be made depending on an individual’s appetite for upside potential, risks, and any previous holdings. This recommendation is purely based on technical analysis, and fundamental analysis has not been considered in this report. Individuals can consider exiting from the stock if the Target Price or Stop loss mentioned as per the technical analysis has been achieved and is subject to the factors discussed above.
Note 3: Related Risks: This report may be looked at from a high-risk perspective and recommendations are provided for a short duration. Recommendations provided in this report are solely based on technical parameters, and the fundamental performance of the stocks has not been considered in the decision-making process. Other factors which could impact the stock prices include market risks, regulatory risks, interest rate risks, currency risks, social and political instability risks etc.
Note 4: How to Read the Charts?
The Yellow color line reflects the 20-period moving average. SMA helps to identify existing price trends. If the prices are trading above the 20-period moving average, then it shows prices are currently trading in a bullish trend.
The Purple color line in the chart’s lower segment reflects the Relative Strength Index (14-Period) which indicates price momentum and signals momentum in trend. A reading of 70 or above suggests overbought status while a reading of 30 or below suggests an oversold status.
The Ink Blue color lines are the trend lines drawn by connecting two or more price points and used for trend identification purposes. The trend line also acts as a line of support and resistance.
Technical Indicators Defined: -
Support: A level at which the stock prices tend to find support if they are falling, and a downtrend may take a pause backed by demand or buying interest. Support 1 refers to the nearby support level for the stock and if the price breaches the level, then Support 2 may act as the crucial support level for the stock.
Resistance: A level at which stock prices tend to find resistance when they are rising, and an uptrend may take a pause due to profit booking or selling interest. Resistance 1 refers to the nearby resistance level for the stock and if the price surpasses the level, then Resistance 2 may act as the crucial resistance level for the stock.
Stop-loss: It is a level to protect against further losses in case of unfavorable movement in the stock prices.
The reference date for all price data, currency, technical indicators, support, and resistance levels is March 25, 2026. The reference data in this report has been partly sourced from REFINITIV.
Abbreviations
CMP: Current Market Price
SMA: Simple Moving Averages
CAD: Canadian Dollar
RSI: Relative Strength Index
USD: United States dollar
Note: Trading decisions require a thorough analysis by individuals. Technical reports in general chart out metrics that may be assessed by individuals before any stock evaluation. The above are illustrative analytical factors used for evaluating stocks; other parameters can be looked at along with additional risks per se. Past performance is neither an indicator nor a guarantee of future performance.

 NZ
 UK
 US
 AU
 IND

 CA

 Please wait processing your request...