Super Micro Computer, Inc
Super Micro Computer, Inc (NASDAQ: SMCI) delivers application-optimized Total IT solutions, specializing in rack-scale infrastructure for AI and high-performance computing. The company provides integrated server, storage, networking, and software platforms serving enterprise, cloud, and edge computing markets, offering end-to-end data center solutions across diverse workloads.

Key Growth Aspects
- Record Revenue Growth and Market Expansion: Supermicro delivered exceptional top-line performance in Q2 FY26, with net sales reaching USD 12.7 billion, representing 123% year-over-year growth and 153% quarter-over-quarter growth. This surge was largely driven by rapid deployment of AI GPU platforms, which accounted for over 90% of quarterly revenue. The company’s ability to exceed guidance and ramp production at scale demonstrates strong execution capabilities and robust demand visibility in AI infrastructure markets.
The revenue acceleration also reflects expanding enterprise and hyperscale customer engagements. Large data center and OEM customers contributed approximately 84% of Q2 revenue, with one large data center customer alone accounting for 63% of total revenue. This highlights Supermicro’s strengthening position in large-scale AI deployments.
- Expanding AI and DCBBS Ecosystem: The company’s Datacenter Building Block Solutions (DCBBS) platform is emerging as a strategic differentiator. According to management commentary, DCBBS has begun gaining customer preference due to faster time-to-deployment and improved energy efficiency. The company expanded its DCBBS portfolio to include over ten subsystems such as cooling towers, battery backup, power shelves, switching, and DC management software.
Management indicated that DCBBS accounted for 4% of profit in the first half of FY26 and is expected to grow into double-digit profit contribution by the end of calendar 2026. This shift toward higher-value infrastructure solutions could structurally enhance margins over time and strengthen competitive positioning in AI factory buildouts.
- Operating Leverage and Earnings Outperformance: Despite margin compression, the company demonstrated strong operating leverage. Non-GAAP diluted EPS reached USD 0.69 in Q2 FY26, compared to USD 0.59 in Q2 FY25, outperforming prior guidance. Operating expenses, as a percentage of revenue, declined significantly due to scale benefits, with non-GAAP operating expenses representing only 1.9% of revenue versus 4.1% in the prior quarter.
The company also improved its cash conversion cycle from 123 days in Q1 to 54 days in Q2, driven by reductions in days of inventory and improved payables management. This reflects improving working capital efficiency amid rapid growth.
- Capacity Expansion and Manufacturing Scale: Supermicro continues expanding its global manufacturing footprint to support AI infrastructure growth. The earnings deck highlights production scale targets of 6,000 racks per month and 3,000 DLC racks per month by FY26 year-end, along with 63MW facilities worldwide. Additionally, the company expanded access to working capital through new secured revolving credit facilities totaling nearly USD 3.8 billion.
These investments position the company to capture sustained AI demand while improving cost efficiency through design-for-manufacturing initiatives and automation enhancements.
Growth Challenges
- Significant Gross Margin Compression: Despite record revenue, profitability metrics deteriorated. Q2 FY26 GAAP gross margin declined to 6.3% from 11.8% in Q2 FY25, while non-GAAP gross margin fell to 6.4% from 11.9% year-over-year. Management attributed the decline to customer mix shifts toward large model builders with pricing leverage, higher expedited transportation costs, component shortages, volatile pricing, and tariffs. This margin contraction suggests that rapid scale-up in AI infrastructure is currently being achieved at the expense of profitability.
- Elevated Customer Concentration Risk: The company reported that one large data center customer accounted for approximately 63% of total Q2 revenue. Such high concentration exposes the company to revenue volatility if demand from that customer slows, pricing renegotiations occur, or competitive dynamics shift.
Furthermore, OEM and large data center customers contributed 84% of Q2 revenue, reducing diversification across enterprise and channel segments.
- Working Capital Intensity and Negative Operating Cash Flow: Although revenue surged, cash flow generation remained pressured. Q2 operating cash flow reflected a USD 24 million outflow, and for the six-month period, operating activities resulted in a net cash outflow of USD 941 million. Accounts receivable and inventory increased sharply, with inventory reaching USD 10.6 billion at quarter-end.
The balance sheet shows significant growth in receivables and inventories relative to prior periods, indicating substantial working capital requirements to sustain high growth.
- Rising Debt and Net Leverage: At quarter-end, the company held USD 4.1 billion in cash against USD 4.9 billion in bank and convertible note debt, resulting in a net debt position of approximately USD 787 million. While credit facilities support expansion, increasing leverage introduces financial risk, particularly in a volatile margin environment.
Additionally, interest expense rose year-over-year, reflecting higher financing costs. Sustained margin pressure combined with elevated debt levels could constrain financial flexibility if AI demand moderates.
Key Risks:
- Customer Concentration Risk: A significant portion of revenue is derived from a limited number of large data center customers, increasing exposure to order volatility and pricing pressure.
- Working Capital Intensity: Rapid revenue expansion requires substantial investment in inventory and receivables, which may strain cash flow during growth cycles.
- Leverage and Financing Risk: Elevated debt levels, including convertible notes and revolving credit facilities, increase interest expense and financial risk if demand moderates.
Technical Observation (on the daily chart):
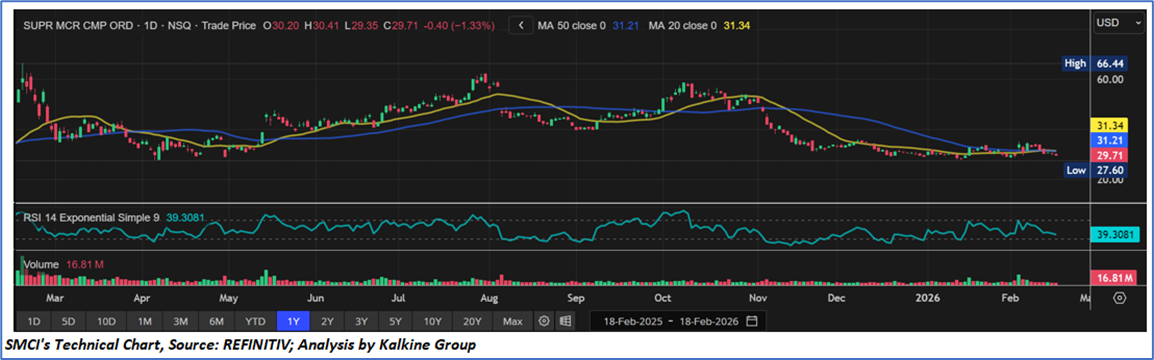
- The stock has transitioned from a prior strong uptrend into a medium-term corrective phase, forming lower highs and lower lows after peaking near USD 66.
- Price is currently trading around USD 29–30 and remains below both the 20-day (USD 31.34) and 50-day (USD 31.21) moving averages, indicating a short-term neutral-to-bearish bias.
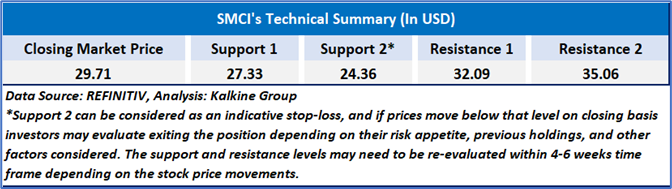
- The USD 31–32 zone now acts as immediate resistance; a sustained breakout above this level would be required to signal a potential trend reversal.
- RSI is around 39, below the neutral 50 mark, reflecting weak momentum but not yet oversold conditions, suggesting consolidation rather than aggressive selling.
- Trading volumes have moderated compared to the earlier sell-off phase, indicating reduced downside pressure but limited evidence of strong accumulation.
Supermicro delivered decent top-line growth in Q2 FY26, with revenue surging 123% year-over-year to USD 12.7 billion, supported by strong AI infrastructure demand, expanding rack-scale deployments, and growing adoption of its DCBBS platform. The company demonstrated operating leverage and improved working capital efficiency sequentially, while raising full-year revenue guidance to at least USD 40 billion. However, this rapid expansion came alongside significant gross margin compression to 6.3%, elevated customer concentration with one client contributing 63% of revenue, negative operating cash flow in the quarter, and a net debt position of approximately USD 787 million. Overall, the results reflect powerful growth momentum in AI infrastructure balanced by profitability pressures and balance sheet risks that warrant careful monitoring.
As per the above-mentioned price action, recent key business and financial updates, momentum in the stock over the last month, and technical indicators analysis, a ‘Watch’ rating has been Super Micro Computer, Inc (NASDAQ: SMCI) at the closing market price of USD 29.71 as of Feb 18, 2026.
Individuals can evaluate the stock based on the support and resistance levels provided in the report in case of keen interest taking into consideration the risk-reward scenario.
Markets are trading in a highly volatile zone currently due to certain macro-economic issues and prevailing geopolitical tensions. Therefore, it is prudent to follow a cautious approach while investing.
Related Risk: This report may be looked at from a high-risk perspective and a recommendation is provided for a short duration. This report is solely based on technical parameters, and the fundamental performance of the stocks has not been considered in the decision-making process. Other factors which could impact the stock prices include market risks, regulatory risks, interest rates risks, currency risks, social and political instability risks etc.
Note 1: Past performance is not a reliable indicator of future performance.
Note 2: The reference date for all price data, currency, technical indicators, support, and resistance level is February 18, 2026. The reference data in this report has been partly sourced from REFINITIV.
Note 3: Investment decisions should be made depending on an individual's appetite for upside potential, risks, holding duration, and any previous holdings. An 'Exit' from the stock can be considered if the Target Price mentioned as per the Valuation and or the technical levels provided has been achieved and is subject to the factors discussed above.
Note 4: Target Price refers to a price level that the stock is expected to reach as per the relative valuation method and or technical analysis taking into consideration both short-term and long-term scenarios.
Note 5: ‘Kalkine reports are prepared based on the stock prices captured either from the New York Stock Exchange (NYSE), NASDAQ Capital Markets (NASDAQ), and or REFINITIV. Typically, all sources (NYSE, NASDAQ, or REFINITIV) may reflect stock prices with a delay which could be a lag of 15-20 minutes. There can be no assurance that future results or events will be consistent with the information provided in the report. The information is subject to change without any prior notice.

 NZ
 UK
 US
 AU
 IND

 CA

 Please wait processing your request...