Company Overview:
Aclara Resources Inc. (TSX: ARA) is a development-stage rare earth mineral resources company with approximately 451,585 hectares of mining concessions located in the Maule Nuble Biobio and Araucan a regions of Chile. It is focused on the development and on the future construction and operation of the Penco Module which aims to produce a rare earth concentrate through a processing plant that will be fed by clays from nearby deposits.
This Report covers the Price Action, Technical Indicators Analysis along with the Support Levels, Resistance Levels, and Recommendations on this stock.
Fundamental Highlights:
Aclara Strengthens Strategic Collaboration: Aclara hosted VAC and eVAC Magnetics at its Carina pilot plant, showcasing decent progress in producing high-purity rare earth materials and advancing plans for an integrated, sustainable mine-to-magnet supply chain across Brazil and the United States. The visit reinforced both companies’ alignment on scalable, ESG-focused growth and future production goals.
Recently, the company also informed about its partnership with Stanford's Mineral-X initiative, which provides a sturdy technological and academic foundation to develop cutting-edge AI-driven exploration models. This positions the company at the forefront of innovation in heavy rare earth elements (HREE) sourcing—an area critical for clean energy technologies—enhancing its long-term competitiveness and discovery efficiency.
ARA’s Technical Observation:
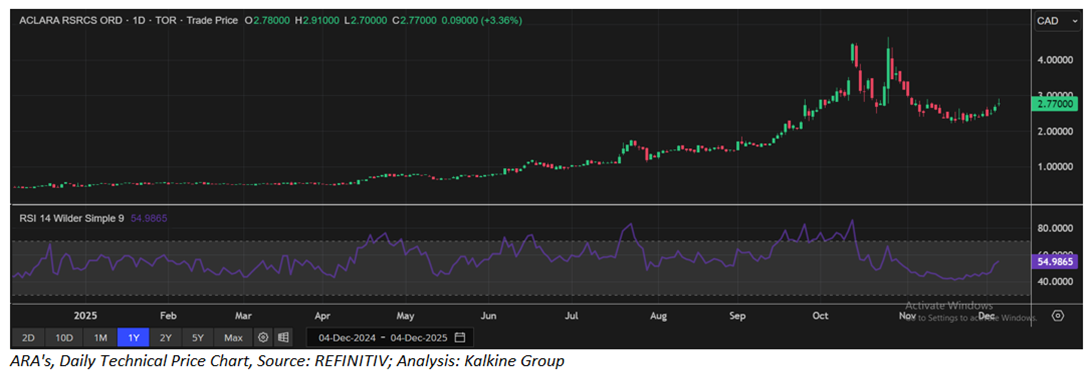
Aclara’s daily price chart shows a steady uptrend into October, followed by a sharp correction and recent stabilization. Price is reclaiming the 14-day SMMA, and RSI has rebounded from oversold levels, suggesting early momentum recovery. A break above ~CAD 3 would strengthen bullish sentiment.

ARA’s Daily Price Chart
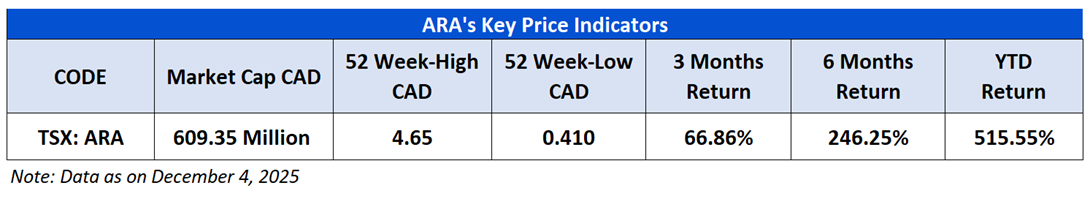
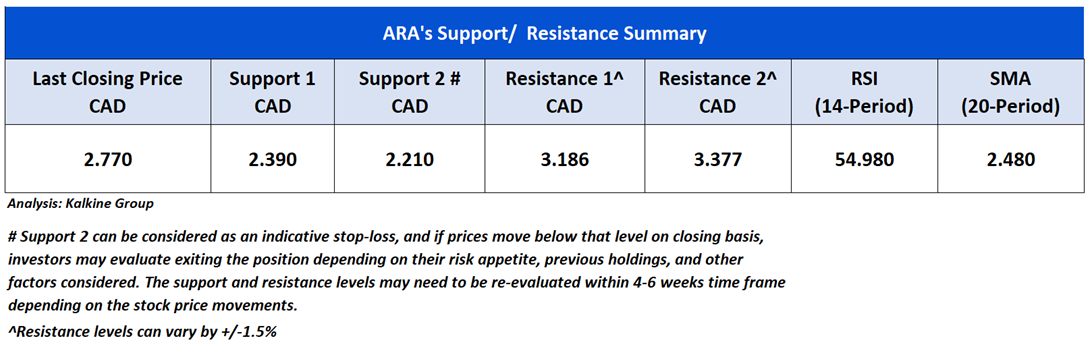
As per the above-mentioned price action and technical indicators analysis, a ‘Speculative Buy’ rating has been given Aclara Resources Inc. (TSX: ARA) at the closing market price of CAD 2.77, as of 4th December 2025. Individuals can evaluate the stock based on the support and resistance levels provided in the report in case of keen interest taking into consideration the risk-reward scenario.
Markets are trading in a highly volatile zone currently due to certain Macro & Micro-economic data and prevailing geopolitical tensions. Therefore, it is prudent to follow a cautious approach while investing.
Note 1: Past performance is not a reliable indicator of future performance.
Note 2: The reference date for all price data, currency, technical indicators, support, and resistance levels as on December 4, 2025. The reference data in this report has been partly sourced from REFINITIV.
Note 3: Investment decisions should be made depending on an individual's appetite for upside potential, risks, holding duration, and any previous holdings. An 'Exit' from the stock can be considered if the Target Price mentioned as per the Valuation and or the technical levels provided has been achieved and is subject to the factors discussed above.
Note 4: Dividend Yield may vary as per the stock price movement.
Note 5: Kalkine reports are prepared based on the stock prices captured either from REFINITIV or Trading View. Typically, REFINITIV or Trading View may reflect stock prices with a delay which could be a lag of 25-30 minutes. There can be no assurance that future results or events will be consistent with the information provided in the report. The information is subject to change without any prior notice.
Technical Indicators Defined: -
Support: A level at which the stock prices tend to find support if they are falling, and a downtrend may take a pause backed by demand or buying interest.
Resistance: A level at which the stock prices tend to find resistance when they are rising, and the uptrend may take a pause due to profit booking or selling interest.
Stop-loss: In general, it is a level to protect further losses in case of any unfavourable movement in the stock prices.
 Please wait processing your request...