Bloom Energy Corporation
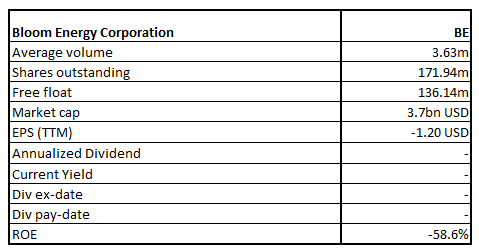
BE Details
Bloom Energy Corporation (NYSE: BE) deals in the business of providing clean, reliable, and affordable energy and for this, it has developed an energy server platform which is a stationary power generation platform capable of delivering highly reliable constant power that is clean and sustainable.
FY20 Results Performance
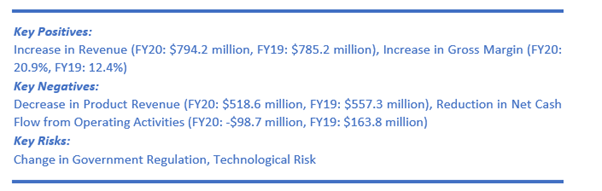
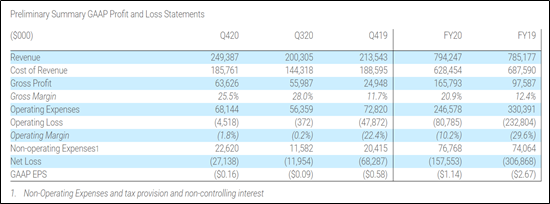
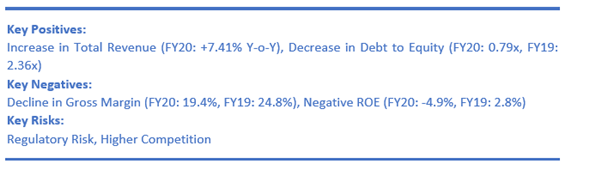
The company has reported a 1.2% YoY rise in revenue to $794.2 million in FY20 as against $785.2 million in FY19 supported by an 11.1% rise in acceptances to 1,326, or 132.6 MW. However, this was offset by the PPA II upgrade which had a positive effect on 2019 revenue. Notably, the company witnessed a significant improvement in its gross margin to 20.9% in FY20 from 12.4% in FY19, a rise of 8.5 percentage points mainly assisted by an uptick in product gross margin to 35.8% from 21.9%. Driven by an improvement in gross margin, the company reported an improvement in the operating loss by 65.3% to $80.8 million and an improvement in the net loss by 48.7% to $157.5 million over the previous year.
Financial Snapshot (Source: Company Reports)
Deployment of Fuel Cells Powered Entirely by Hydrogen
The company, on 27 April 2021, announced that, in collaboration with its Korean partner, SK Engineering & Construction Co., Ltd., it has successfully installed 100 kilowatts of solid-oxide fuel cells (SOFC) which is entirely powered by hydrogen in Ulsan, South Korea.
Outlook
The FY20 results of the company reflect improvement in financial performance across revenue, gross margin, operating income, and net income. It has a strong backlog for 2021 that provides high project visibility and improving cash flow outlook.
In the meanwhile, the company has reaffirmed its 2021 guidance wherein it expects to achieve revenue in the range of $950 million - $1 billion. It also expects to garner a non-GAAP gross margin of ~25% in FY21 and a non-GAAP operating margin of around 3% in FY21, without taking into consideration the stock-based compensation.
Key Risks
The company’s operations are exposed to global economic conditions and uncertainties in the geopolitical environment where it operates. Further, its financial performance is vulnerable to tremendous upfront costs incurred for the energy servers, manufacturing defects risk, lengthy sales and installation cycle of its products, among others.
Valuation Methodology: EV/Sales Based Relative Valuation (Illustrative)
Technical Overview:
Weekly Chart –
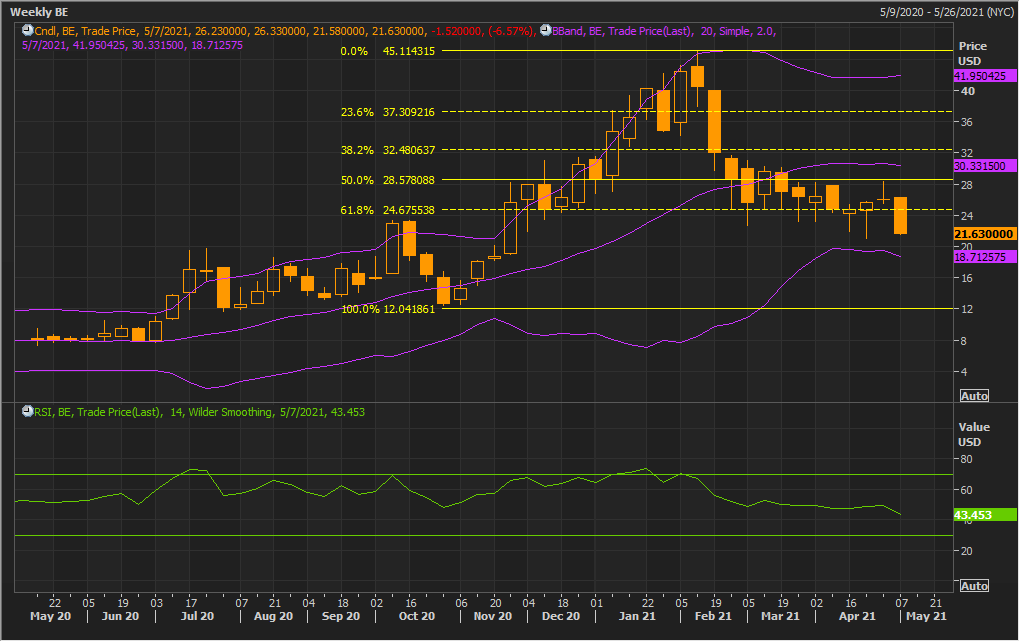
Source: Refinitiv (Thomson Reuters)
Note: Purple colour lines are Bollinger Bands® with the upper band suggesting overbought status while the lower band oversold status, and yellow lines are Fibonacci retracement lines which measure price rebound and backtrack. https://www.bollingerbands.com/
The stock has seen a sell-off in the ongoing week whereby it made the low of $21.58 and closed around $21.63. The technical indicator RSI with a reading around 43 and a curve at the end pointing down, suggests neutral to weak momentum for the stock.
Going forward, the stock may have resistance around the 50% retracement level of $28.58 whereas support could be around the lower Bollinger band of $18.71.
Stock Recommendation
BE has delivered 6-month and 9-month returns of ~+56.7% and ~+54.3%, respectively. The stock made the 52-week low and high of $7.255 and $44.9, respectively.
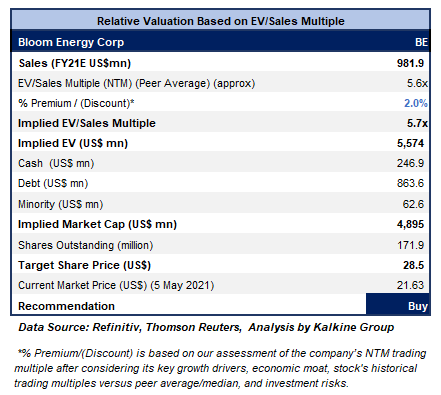
We have valued the stock using an EV/Sales multiple-based illustrative relative valuation and have arrived at a target price that reflects a rise of low double-digit (in % terms). Meanwhile, the company highlighted that the traction in its booking in H2FY20 coupled with a healthy backlog for 2021 brightens visibility on its 2021 guidance framework and upgrade in cash flow outlook. Resultantly, we have assigned a slight premium to EV/Sales Multiple (NTM) (Peer Average). For the purpose of relative valuation, we have taken peers like Rockwell Automation Inc (ROK.N), Generac Holdings Inc (GNRC.N), Romeo Power Inc (RMO.N), to name a few.
Given the strong financial performance and operating results in FY20, solid liquidity position, decent outlook, and expected turnaround in earnings in FY21, we give a “Buy” recommendation on the stock at the current market price of $21.63 per share, down by 6.57% on 5th May 2021.
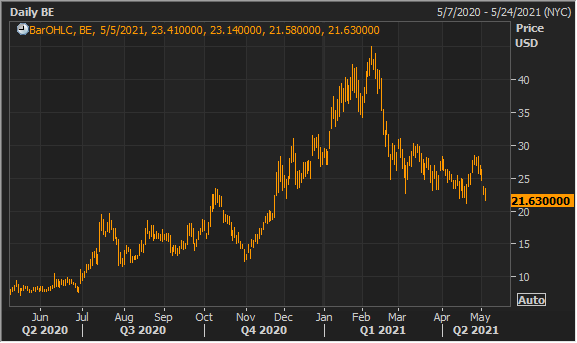
BE Daily Technical Chart (Source: Refinitiv (Thomson Reuters))
Sunrun Inc.
RUN Details
Sunrun Inc. (NASDAQ: RUN) is the top solar company in the U.S that provides residential solar, storage and energy services to the customers.
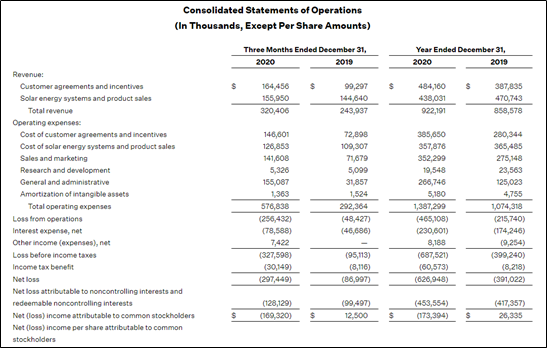
FY20 Results Performance (For the Period Ended 31 December 2020)
The company has logged a decent performance in FY20 with total revenue recording growth of 7.41% YoY to $922.19 million. Customer agreements and incentives revenue registered a growth of 25% YoY to $484.2 million whereas solar energy system and product sales revenue decreased by 7% YoY to $438.0 million. However, total operating expenses during the full year increased by 29.1% YoY to $1387.3 million which led to a rise of 60.3% in the net loss to $626.9 million for the company.
Consolidated Financial Snapshot (Source: Company Reports)
Expanded Product Offering in Texas
The company, on 24 February 2021, announced that it has augmented its home solar and battery offering in Texas by launching its bright box rechargeable solar battery system and making it available for the residents of San Antonio.
Outlook
The company has delivered sequential volume growth and margin expansion. The customers’ additions remained healthy at 84,559 during the year, which also includes subscriber additions of 70,774. This takes the total number of customers to 550,078, including 478,910 subscribers. Solar energy capacity installed during the year stood at 603 megawatts while that for subscribers was 511 megawatts. Further, with the completion of the acquisition of Vivint Solar, the management has raised the expected cost synergies from the transaction to $120 million from $90 million by the end of 2021. Meanwhile, RUN is expecting to boost its growth rate to 20-25% along with achieving total value generated above $700 million in 2021.
Key Risks
The company’s operations are exposed to risks like the impact of COVID-19 on the business and operations as well as the effective integration of Vivint Solar, fluctuations in the electricity production retail prices, among others.
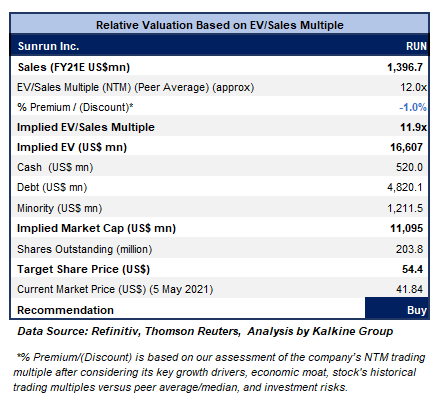
Valuation Methodology: EV/Sales Based Relative Valuation (Illustrative)
Technical Overview:
Weekly Chart –
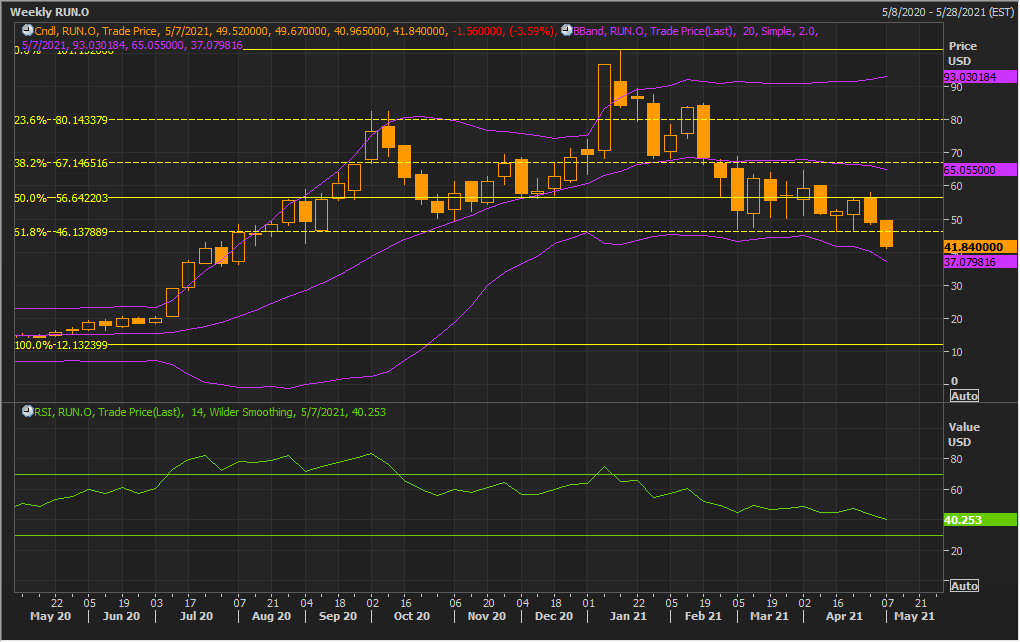
Source: Refinitiv (Thomson Reuters)
Note: Purple colour lines are Bollinger Bands® with the upper band suggesting overbought status while the lower band oversold status, and yellow lines are Fibonacci retracement lines which measure price rebound and backtrack. https://www.bollingerbands.com/
The stock has witnessed consecutive weeks of sell-off with closing around the low price. The technical indicator RSI with a reading around 40 and a curve at the end pointing down, suggests weaker momentum for the stock.
Going forward, the stock may have resistance around the 50% retracement level of $56.64 whereas support could be around the lower Bollinger band of $37.07.
Stock Recommendation
The stock fell by ~22.5% in 6 months and by ~43.5% in 3 months. It has made a 52-week low and high of $12.65 and $100.93, respectively. The stock is trading lower than the average of the 52-week high price of $100.93 and 52-week low price of $12.65, which indicates a good opportunity for accumulation.
We have valued the stock using an EV/Sales multiple-based illustrative relative valuation and have arrived at a target price that reflects a rise of low double-digit (in % terms). We have applied a slight discount to EV/Sales Multiple (NTM) (Peer Average) considering its negative ROE and the risk of fluctuations in the electricity production retail prices. For the purpose of relative valuation, we have taken peers like Vicor Corp (VICR.OQ), Beam Global (BEEM.OQ), Energous Corp (WATT.OQ), to name a few. Meanwhile, the company is anticipating a break-out in 2021 driven by the benefits of sustained operational improvements and strategic advantage from the higher scale.
Considering the aforementioned factors along with a healthy liquidity position and decent growth outlook, we give a “Buy” recommendation on the stock at the current market price of US$41.84, down by 3.59% on 5th May 2021.
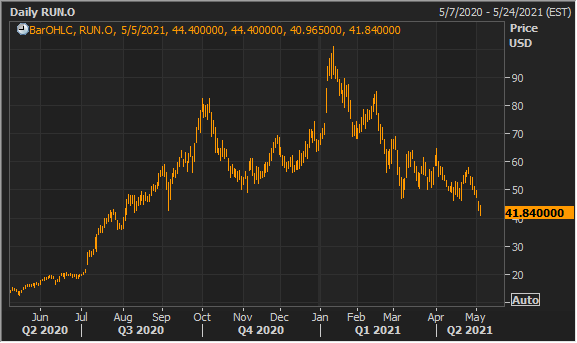
RUN Daily Technical Chart (Source: Refinitiv (Thomson Reuters))
Note: Investment decisions should be made depending on the investors’ appetite on upside potential, risks, holding duration, and any previous holdings. Investors can consider exiting from the stock if the Target Price mentioned as per the Valuation has been achieved and subject to the factors discussed above.
Disclaimer
The advice given by Kalkine Canada Advisory Services Inc. and provided on this website is general information only and it does not take into account your investment objectives, financial situation and the particular needs of any particular person. You should therefore consider whether the advice is appropriate to your investment objectives, financial situation and needs before acting upon it. You should seek advice from a financial adviser, stockbroker or other professional (including taxation and legal advice) as necessary before acting on any advice. Not all investments are appropriate for all people. The website www.kalkine.ca is published by Kalkine Canada Advisory Services Inc. The link to our Terms & Conditions has been provided please go through them. On the date of publishing this report (mentioned on the website), employees and/or associates of Kalkine do not hold positions in any of the stocks covered on the website. These stocks can change any time and readers of the reports should not consider these stocks as advice or recommendations later.
.jpg)
 Please wait processing your request...