Ford Motor Company

F Details
Ford Motor Co. (NYSE: F) manufactures automobiles under its Ford as well as Lincoln brands.
Financial Results
- The company’s fourth-quarter 2023 revenue stood at $46 Bn, reflecting an increase of 4% from the same period a year ago on comparable vehicle volumes. Notably, net pricing was favorable.
- The net loss of $526 Mn in the period was attributable to $1.7 Bn pretax, non-cash accounting loss associated to the remeasurement of pension as well as other postretirement employee benefits plans.
- For full-year 2023, the company’s revenue rose by 11% to $176 billion.
Outlook
The company is expecting full-year 2024 adjusted EBIT of $10 Bn - $12 Bn as well as to generate $6 Bn - $7 Bn in adjusted FCF, with capital expenditures of $8 Bn - $9.5 Bn.
Key Risks
Legal and regulatory risks, economic or geopolitical developments (such as protectionist trade policies like tariffs), weak global growth, etc. are some of the risks Ford is exposed to.
Fundamental Valuation
P/E Based Relative Valuation
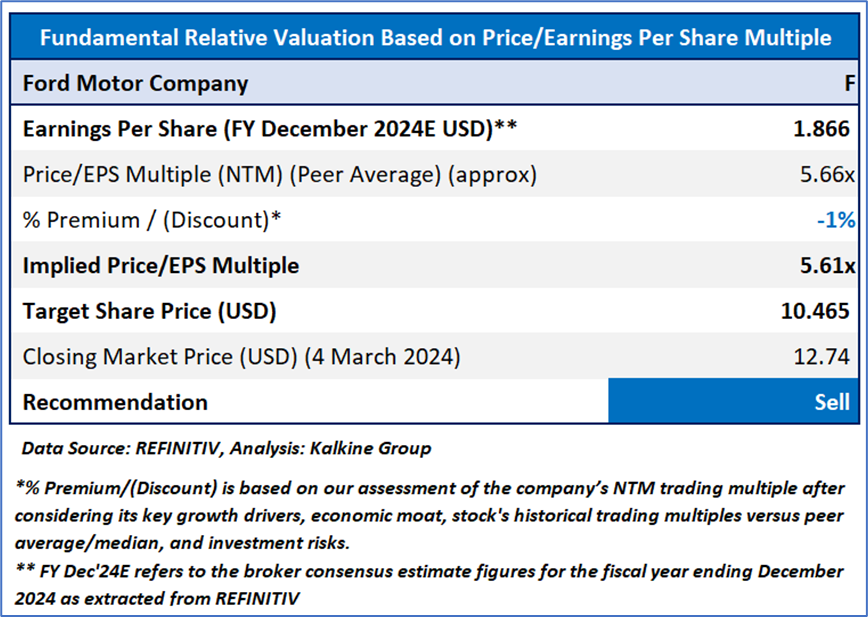
Stock Recommendation
Over the last three months, the stock has given a return of 20.7%. The stock has made a 52-week low and high of USD 9.49 and USD 15.1, respectively.
Notably, the inflationary pressures as well as fluctuations in commodity and energy prices, foreign currency exchange rates, interest rates, and market value of Ford or Ford Credit’s investments, might have significant impact on the company’s results. Therefore, investors should exit the stock.
Hence, a ‘Sell’ rating has been provided on the stock at the closing price of USD 12.74 per share, up by 2.33% as on 4 March 2024
Technical Overview:
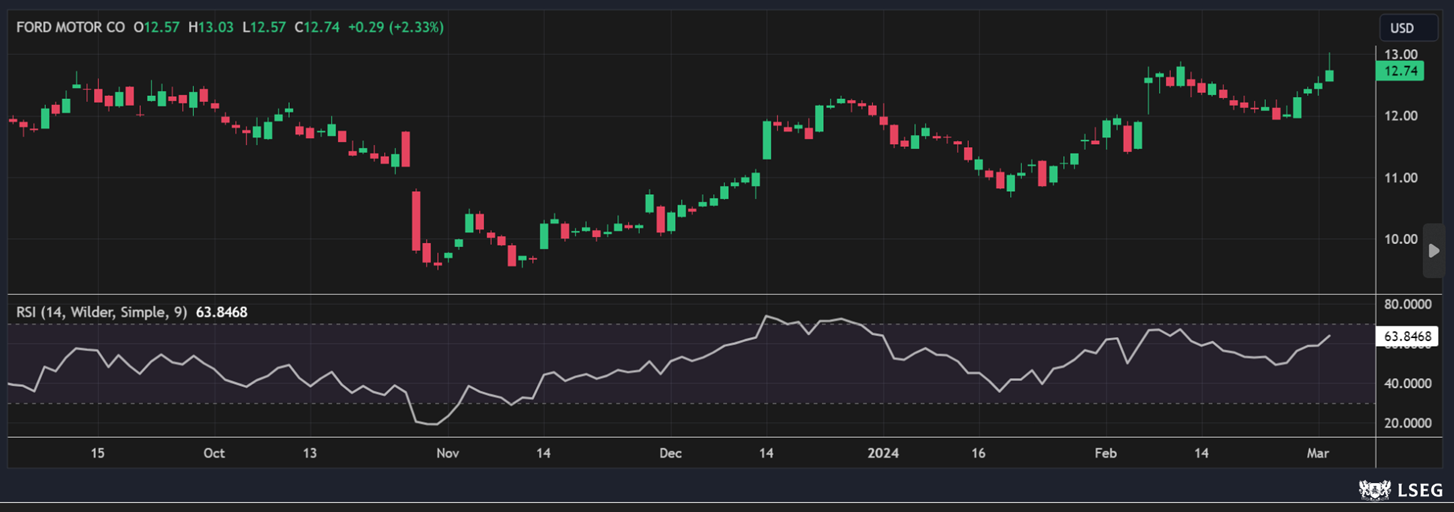
F Daily Technical Chart, Data Source: REFINITIV
Markets are trading in a highly volatile zone currently due to certain macro-economic and geopolitical tensions prevailing. Therefore, it is prudent to follow a cautious approach while investing.
Note 1: Past performance is neither an indicator nor a guarantee of future performance.
Note 2: The reference date for share price chart and stock valuation is based on March 4, 2024. The reference data in this report has been partly sourced from REFINITIV.
Note 3: Investment decisions should be made depending on an individual's appetite for upside potential, risks, holding duration, and any previous holdings. An 'Exit' from the stock can be considered if the Target Price mentioned as per the Valuation and or the technical levels provided has been achieved and is subject to the factors discussed above.

 Please wait processing your request...