This report is an updated version of the report published on 28 November 2025 at 2:56 PM AEDT.
Paradigm Biopharmaceuticals Limited (ASX: PAR)
Paradigm Biopharmaceuticals Limited (ASX: PAR) is a global, clinically advanced biopharma company developing pentosan polysulfate sodium (PPS) for osteoarthritis and other inflammatory diseases. With a Phase 3 lead asset, Zilosul®, the company targets major unmet medical needs globally. Headquartered in Melbourne, PAR operates across the US and the EU.
Recommendation Rationale – SELL at AUD 0.375
- Trading Near Resistance Levels: PAR’s share price surpassed its R1 level recommended on 21 November 2025. Therefore, share price can face resistance at the current levels.
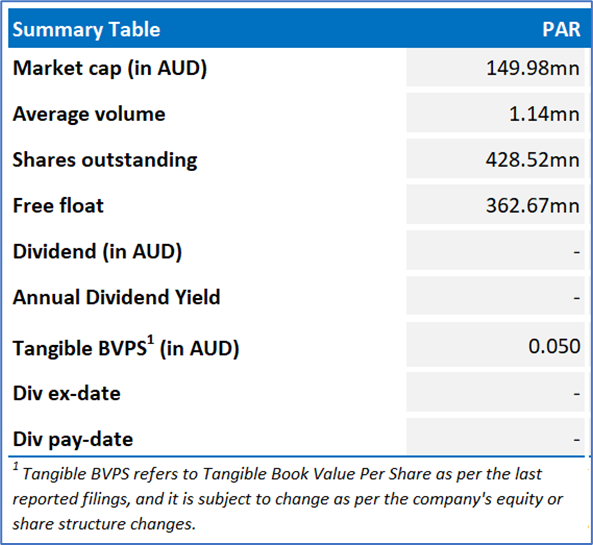
- Overvalued Multiples: On a forward 12-month basis – key trading multiple (P/BV) is higher than the average of the Healthcare sector.
- Losses in FY25: The Group posted a loss of AUD 18.8 million in FY25. Continued losses could pressure resources, limit growth prospects, and may require further funding or capital raising to sustain operations. Cash balance also declined 6% YoY as of 30 June 2025.
- Technical Commentary: PAR surged 7.14% on the daily chart but is now testing a key horizontal resistance level, limiting further upside. The RSI at 54.38 is holding near the upper band, indicating momentum may be losing strength and could reverse from current levels. With price stretched into resistance and signs of slowing momentum, the setup suggests a potential pullback, making this zone favourable for considering a sell view or profit booking.
- Market Risks: Paradigm faces several risks, including heavy reliance on successful Phase 3 outcomes for iPPS, where delays, safety issues, or failure to meet clinical endpoints could impact timelines and commercial potential. With no commercial revenue, the company depends on external funding, and higher-than-expected trial costs or market volatility may require further capital raises, posing dilution risk. Even with regulatory approval, market success will depend on pricing, reimbursement, competitive positioning, and physician adoption amid strong competition from existing and emerging osteoarthritis treatments.
PAR Daily Chart
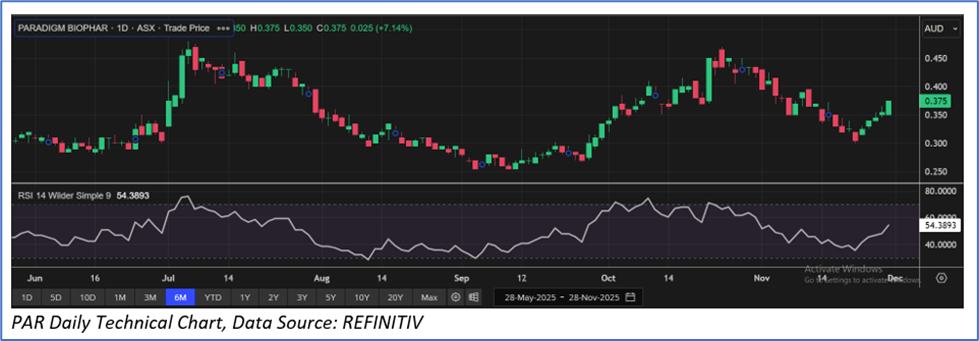
Considering that the stock has surpassed its R1 level, macroeconomic uncertainty, rally in share price movement, current trading level, and risks associated, the share price can face consolidation at the current levels. Hence, a ‘Sell’ recommendation is given on the stock at the current price of AUD 0.375 (as of 28 November 2025, at 2:09 PM AEDT).
Note: This report may be updated with details around fundamental and technical analysis, price/ chart in due course, as appropriate.
Note 1: Past performance is neither an indicator nor a guarantee of future performance.
Note 2: The reference date for all price data, currency, technical indicators, support, and resistance levels is 28 November 2025. The reference data in this report has been partly sourced from REFINITIV.
Note 3: Investment decisions should be made depending on an individual's appetite for upside potential, risks, holding duration, and any previous holdings. An 'Exit' from the stock can be considered if the Target Price mentioned as per the Valuation and or the technical levels provided has been achieved and is subject to the factors discussed above.
Note 4: Kalkine reports are prepared based on the stock prices captured either from REFINITIV or Trading View. Typically, REFINITIV or Trading View may reflect stock prices with a delay which could be a lag of 25-30 minutes. There can be no assurance that future results or events will be consistent with the information provided in the report. The information is subject to change without any prior notice.
Technical Indicators Defined: -
Support: A level at which the stock prices tend to find support if they are falling, and a downtrend may take a pause backed by demand or buying interest. Support 1 refers to the nearby support level for the stock and if the price breaches the level, then Support 2 may act as the crucial support level for the stock.
Resistance: A level at which the stock prices tend to find resistance when they are rising, and an uptrend may take a pause due to profit booking or selling interest. Resistance 1 refers to the nearby resistance level for the stock and if the price surpasses the level, then Resistance 2 may act as the crucial resistance level for the stock.
Stop-loss: It is a level to protect further losses in case of unfavourable movement in the stock prices.

 Please wait processing your request...