Ormat Technologies Inc

ORA Details
Ormat Technologies, Inc. (NYSE: ORA) is engaged in the business of providing renewable power and energy solutions to its customers globally. It provides clean, reliable energy solutions which it generates from geothermal and recovered energy. It also provides energy management and storage solutions. The company has a market capitalization of ~$3.8 billion as on June 17, 2021.
Result Performance (Year Ended 31 December 2020 – FY20)
The company recorded a 5.5% YoY decline in overall revenue to $705.3 million due to lower revenue from the product segment which declined by 22.5% YoY to $148.1 million, overshadowing the increase in revenue from both the electricity segment which grew by 0.2% YoY to $541.4 million and energy storage segment which grew by 7.5% YoY to $15.8 million. Adjusted EBITDA for the year stood at $420.2 million, an increase of 9.3% over the previous year. Further, the net income of the company (excluding non-controlling interest) for the year increased by 8.8% to $101.8 million on $93.54 million in the previous year.
The company generated consolidated power of 6,043,993 MWh during the year, a decrease of 3.1% YoY. The average prices for the year stood at $89.6 against $86.6 per MWh in the previous year.
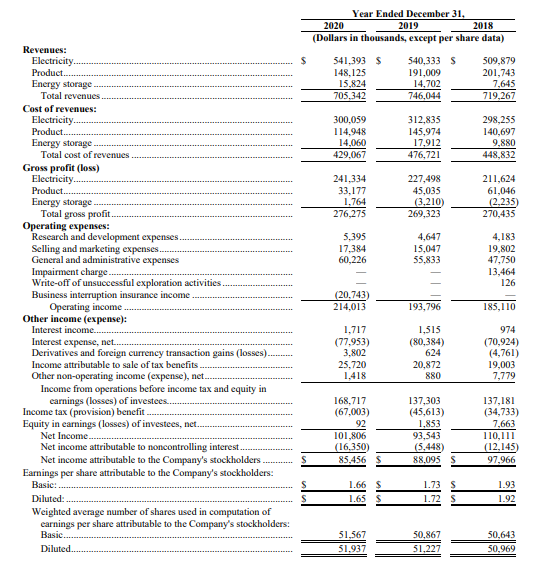
Income Statement (Source: Company Reports)
Q1FY21 Update:
For the Q1FY21 ended March 31, 2021, the company reported a 13.4% YoY decline in revenue to $166.4 million whereby electricity revenue increased by 1.5% YoY to $145.0 million and storage revenue increased by 589.1% YoY to $12.7 million whilst product revenue declined by 81.8% YoY to $8.6 million. Adjusted EBITDA for the period declined by 6.4% YoY to $99.24 million on $106.04 million in the prior year. It reported a 40.4% YoY decline in net income for the period to $17.83 million on $29.90 million in the prior year.
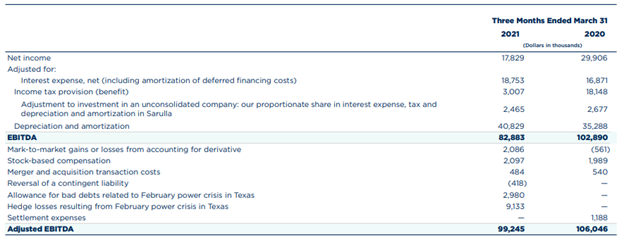
Key Data (Source: Company Reports)
Outlook:
The company enjoys a consistent track record of strong returns for shareholders. It has long-term contracted cash flows, a strong balance sheet and favourable leverage profile. Besides, there is robust growth potential under favourable regulatory dynamics.
ORA expects to achieve revenue in the range of $645 million and $680 million and adjusted EBITDA in the range of $400 million and $410 million in FY21.
Key Risks
The company’s global operations are exposed to risks like foreign laws and regulations along with geopolitical risk, and acts of terrorism. Besides, a sustained drop in product backlog would have an adverse bearing on its target of full utilization of the production and manufacturing facilities.
Valuation Methodology: EV/Sales Based Relative Valuation (Illustrative)
Technical Overview:
Weekly Chart –
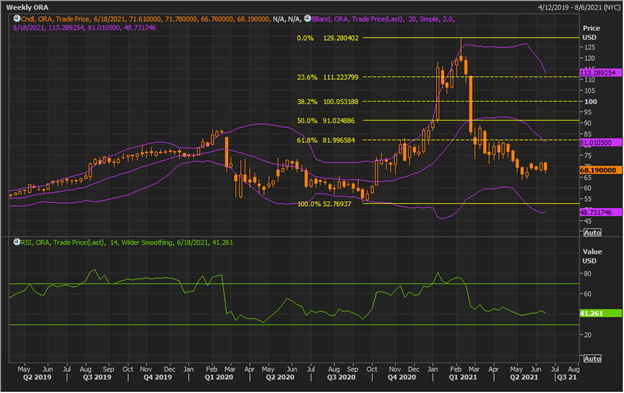
Source: REFINITIV
Note: Purple colour lines are Bollinger Bands® with the upper band suggesting overbought status while the lower band oversold status, and yellow lines are Fibonacci retracement lines which measure price rebound and backtrack. https://www.bollingerbands.com/
The stock has been in a downtrend. Consistent with its existing trend, it has given a weaker close for the ongoing week at $68.19. The technical indicator RSI with a reading around 41 suggests neutral momentum for the stock.
Going forward, the stock may have resistance around the 61.8% retracement level of $81.99 whereas support could be around $60.00.
Stock Recommendation:
The company’s net margin for Q1FY21 stood at 10.4%, better than the industry median of -1.1%. Its ROE for Q1FY21 stood at 0.8%, as compared to -0.9% of the industry median. Its current ratio for Q1FY21 stood at 2.85x, better than the industry median of 1.18x. Thus, the company enjoys better returns and liquidity profiles than its peers.
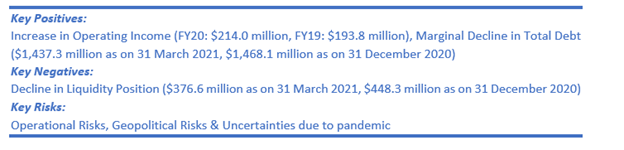
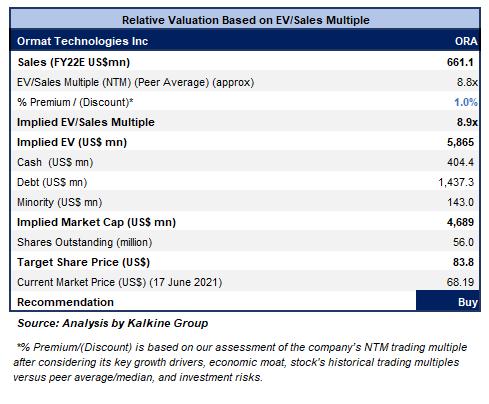
We have valued the stock using an EV/Sales multiple-based illustrative relative valuation and have arrived at a target price that reflects a rise of low double-digit (in % terms). We have assigned a slight premium to EV/Sales Multiple (NTM) (Peer Average) considering better operating income and fall in total debt.
The stock rose by ~22.99% in 9 months. It has made a 52-week low and high of $53.4400 and $128.8700, respectively.
Considering the aforesaid facts, we give a “Buy” recommendation on the stock at the current market price of $68.19 per share, up by 0.6% as on 17th June 2021.
Note 1: The reference data in this report has been partly sourced from REFINITIV.
Note 2: Investment decisions should be made depending on the investors’ appetite on upside potential, risks, holding duration, and any previous holdings. Investors can consider exiting from the stock if the Target Price mentioned as per the analysis has been achieved and subject to the factors discussed above alongside support levels provided.
Technical Indicators Defined:-
Support: A level where-in the stock prices tend to find support if they are falling, and downtrend may take a pause backed by demand or buying interest.
Resistance: A level where-in the stock prices tend to find resistance when they are rising, and uptrend may take a pause due to profit booking or selling interest.
Disclaimer
The advice given by Kalkine Canada Advisory Services Inc. and provided on this website is general information only and it does not take into account your investment objectives, financial situation and the particular needs of any particular person. You should therefore consider whether the advice is appropriate to your investment objectives, financial situation and needs before acting upon it. You should seek advice from a financial adviser, stockbroker or other professional (including taxation and legal advice) as necessary before acting on any advice. Not all investments are appropriate for all people. The website www.kalkine.ca is published by Kalkine Canada Advisory Services Inc. The link to our Terms & Conditions has been provided please go through them. On the date of publishing this report (mentioned on the website), employees and/or associates of Kalkine do not hold positions in any of the stocks covered on the website. These stocks can change any time and readers of the reports should not consider these stocks as advice or recommendations later.

 Please wait processing your request...