This report is an updated version of the report published on 1 December 2025 at 11:21 AM AEDT
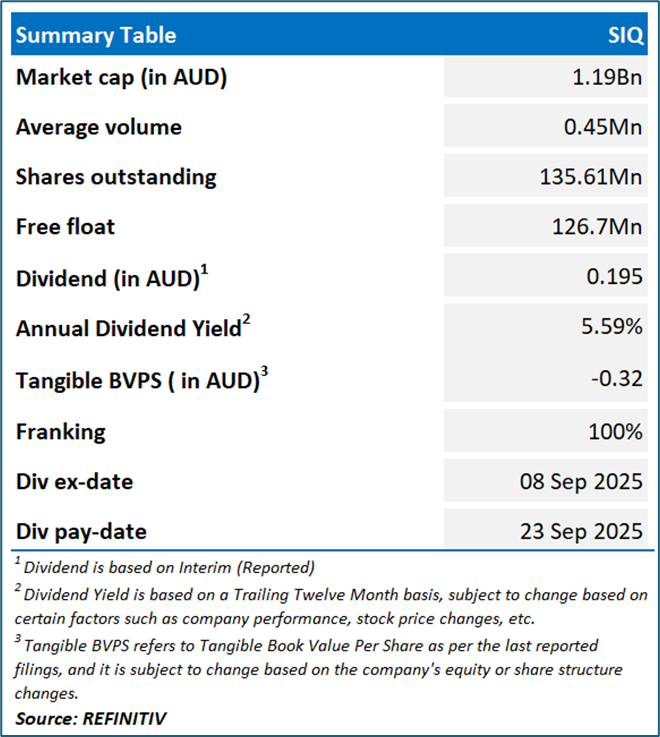
Smartgroup Corporation Ltd (ASX: SIQ)
Smartgroup Corporation Ltd is an Australia-based company, which is engaged in providing outsourced administration, fleet management, and software, distribution, and group services. The Company operates through three segments: Outsourced administration (OA), Vehicle services (VS), and Software, distribution, and group services (SDGS).
Recommendation Rationale – SELL at AUD 9.03
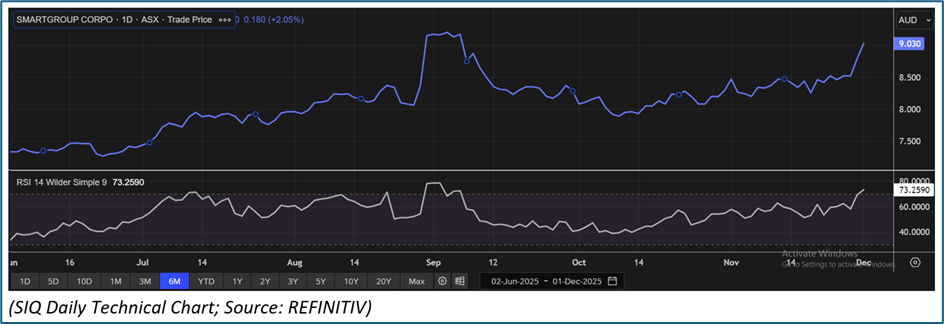
- Technical Standpoint: SIQ’s share price has surpassed the R1 level of AUD 8.704 recommended on 16 October 2025. The 14-day RSI is showing a reading of ~73.26, indicating overbought territory, hence the stock may witness some consolidation in the near term.
- Operating Expenses Jump: In H1FY25 ending 30 June 2025, SIQ's total operating costs increased by 4% year-on-year to AUD 89.5mn compared to AUD 85.7mn in H1FY24.
- Overvalued Multiples: On a forward 12-month basis – key trading multiples (EV/Sales, EV/EBITDA, P/E, Price/Cash Flow and Price/Book Value) are higher than industry (Professional & Commercial Services) median, hence, look overvalued.
- Client Concentration Risk: SIQ has several large government and corporate clients. Loss of a major contract—especially in the public sector—can significantly reduce recurring revenue, as transitions often involve competitive tender processes.
Daily Price Chart
Valuation Methodology: Price/Cash Flow Per Share Approach (Illustrative)
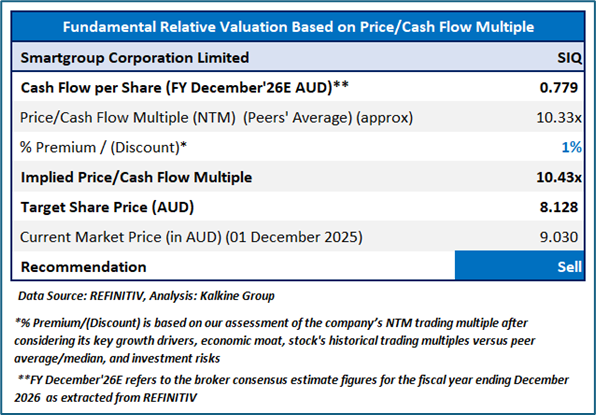
The stock might trade at a slight premium to its peers considering the 200bps increase in EBITDA margin in H1FY25, YoY revenue, EBITDA and NPAT growth reported in H1FY25, reduced product costs and finance costs in H1FY25.
For conducting the valuation, peers including McMillan Shakespeare Ltd (ASX: MMS), Kelsian Group Ltd (ASX: KLS), Monadelphous Group Ltd (ASX: MND) and others have been considered.
Given the stock has crossed its R1 level, recent rally in the share price, and risks associated, it is prudent to sell the stock at the current levels. Hence, a ‘Sell’ recommendation is given on the stock at the current market price of AUD 9.03, as of 1 December 2025, at 10:21 AM AEDT.
Markets are trading in a highly volatile zone currently due to certain macro-economic issues and geopolitical issues prevailing geopolitical tensions. Therefore, it is prudent to follow a cautious approach while investing.
Note 1: Past performance is neither an indicator nor a guarantee of future performance.
Note 2: The reference date for all price data, currency, technical indicators, support, and resistance levels is 1 December 2025. The reference data in this report has been partly sourced from REFINITIV.
Note 3: Investment decisions should be made depending on an individual's appetite for upside potential, risks, holding duration, and any previous holdings. An 'Exit' from the stock can be considered if the Target Price mentioned as per the Valuation and or the technical levels provided has been achieved and is subject to the factors discussed above.
Note 4: Kalkine reports are prepared based on the stock prices captured either from REFINITIV or Trading View. Typically, REFINITIV or Trading View may reflect stock prices with a delay which could be a lag of 25-30 minutes. There can be no assurance that future results or events will be consistent with the information provided in the report. The information is subject to change without any prior notice.
Note 5: Dividend Yield may vary as per the stock price movement.
Technical Indicators Defined: -
Support: A level at which the stock prices tend to find support if they are falling, and downtrend may take a pause backed by demand or buying interest.
Resistance: A level at which the stock prices tend to find resistance when they are rising, and uptrend may take a pause due to profit booking or selling interest.
Stop-loss: In general, it is a level to protect further losses in case of any unfavourable movement in the stock prices

 Please wait processing your request...