
This report is an updated version of the report published on 21 January 2025 at 1:38 PM AEDT.
Corporate Travel Management Limited (ASX: CTD)
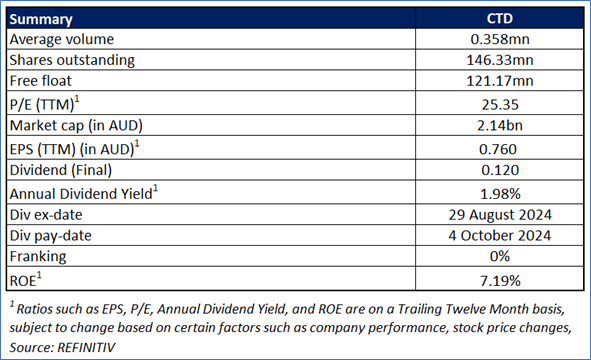
CTD is an Australia-based firm that offers business travel management services. Its primary activities include coordinating the buying and delivery of travel services for its clients. The company's segments comprise Australia and New Zealand, North America, Asia, and Europe.
Recommendation Rationale - SELL at AUD 14.62
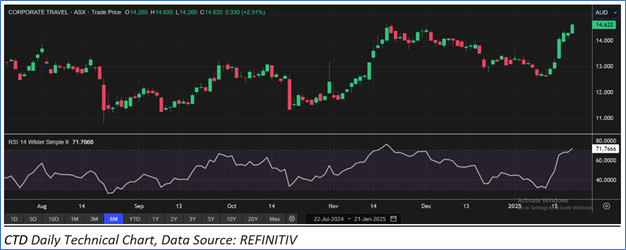
CTD Daily Chart
Valuation Methodology: EV/Sales Approach (FY Jun'25E) (Illustrative)
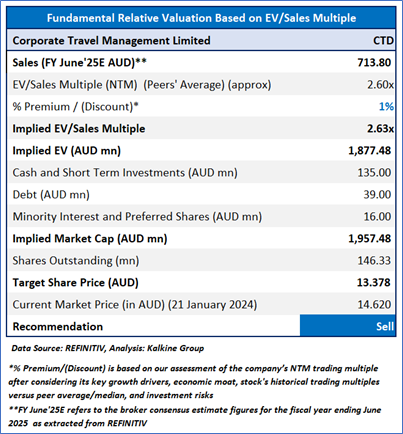
Stock might trade at a slight premium to its peers, considering the revenue and NPAT growth in FY24, expansion in EBITDA margin, and operating margin, etc. For conducting valuation, the following peers have been considered: Web Travel Group Ltd (ASX: WEB), Flight Centre Travel Group Ltd (ASX: FLT), Jumbo Interactive Ltd (ASX: JIN), and others.
Considering that the stock has entered overbought zone, market uncertainties, and risks associated, the share price can witness some correction at the current levels before moving higher. Hence, a ‘Sell’ recommendation is given on the stock at the current market price of AUD 14.620, as of 21 January 2025 at 1:02 PM, AEDT.
Markets are trading in a highly volatile zone currently due to certain macro-economic issues and geopolitical issues prevailing geopolitical tensions. Therefore, it is prudent to follow a cautious approach while investing.
Note 1: Past performance is neither an indicator nor a guarantee of future performance.
Note 2: The reference date for all price data, currency, technical indicators, support, and resistance levels is 21 January 2025. The reference data in this report has been partly sourced from REFINITIV.
Note 3: Investment decisions should be made depending on an individual's appetite for upside potential, risks, holding duration, and any previous holdings. An 'Exit' from the stock can be considered if the Target Price mentioned as per the Valuation and or the technical levels provided has been achieved and is subject to the factors discussed above.
Note 4: Dividend Yield may vary as per the stock price movement.
Note 5: Kalkine reports are prepared based on the stock prices captured either from REFINITIV or Trading View. Typically, REFINITIV or Trading View may reflect stock prices with a delay which could be a lag of 25-30 minutes. There can be no assurance that future results or events will be consistent with the information provided in the report. The information is subject to change without any prior notice.
Technical Indicators Defined: -
Support: A level at which the stock prices tend to find support if they are falling, and downtrend may take a pause backed by demand or buying interest.
Resistance: A level at which the stock prices tend to find resistance when they are rising, and uptrend may take a pause due to profit booking or selling interest.
Stop-loss: In general, it is a level to protect further losses in case of any unfavourable movement in the stock prices.
The advice given by Kalkine Canada Advisory Services Inc. and provided on this website is general information only and it does not take into account your investment objectives, financial situation and the particular needs of any particular person. You should therefore consider whether the advice is appropriate to your investment objectives, financial situation and needs before acting upon it. You should seek advice from a financial adviser, stockbroker or other professional (including taxation and legal advice) as necessary before acting on any advice. Not all investments are appropriate for all people. The website www.kalkine.ca is published by Kalkine Canada Advisory Services Inc. The link to our Terms & Conditions has been provided please go through them. On the date of publishing this report (mentioned on the website), employees and/or associates of Kalkine do not hold positions in any of the stocks covered on the website. These stocks can change any time and readers of the reports should not consider these stocks as advice or recommendations later.
 Please wait processing your request...