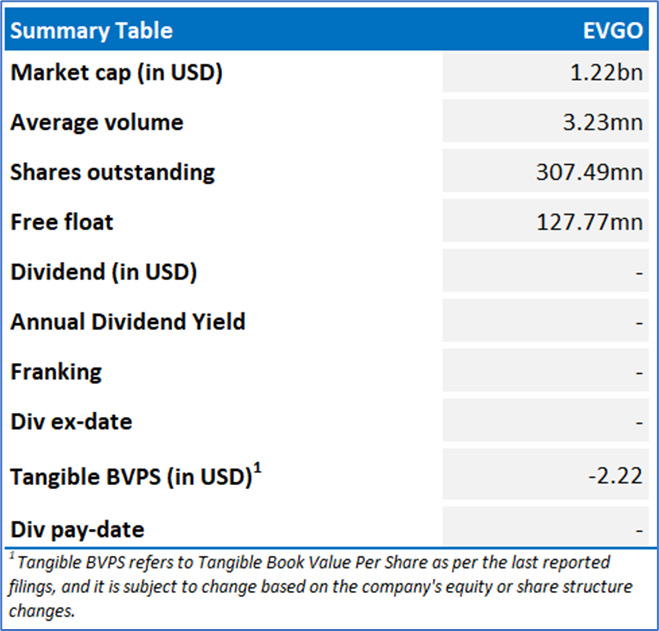
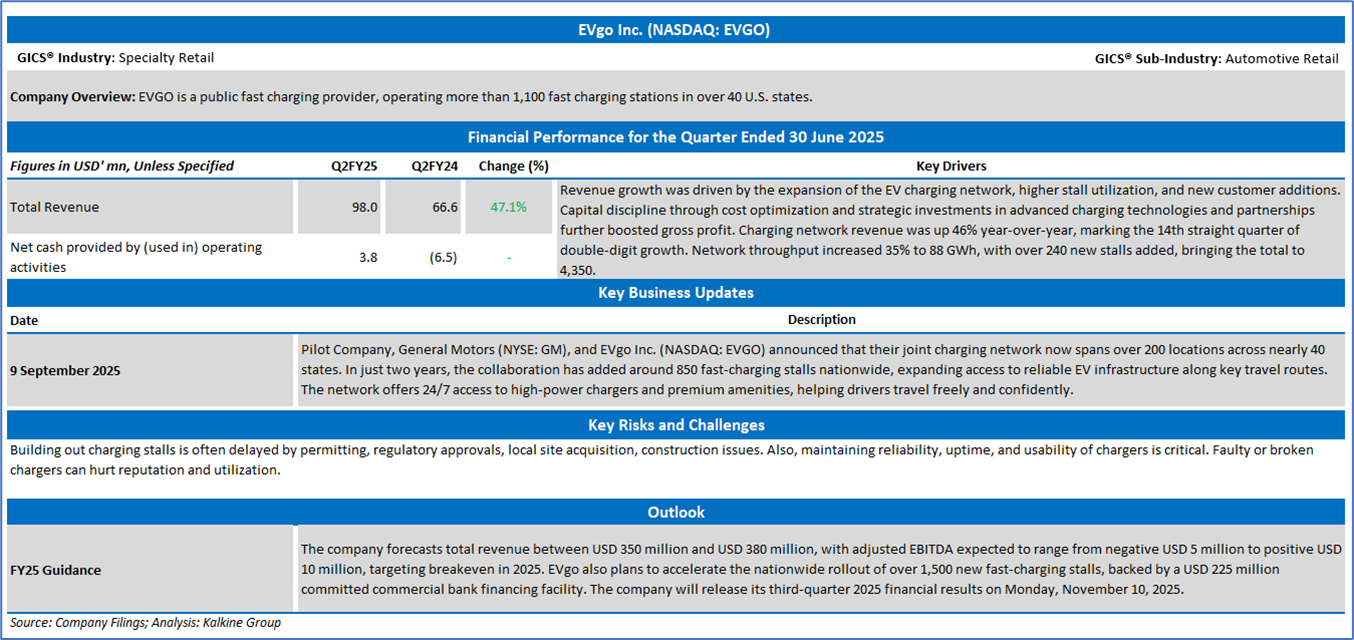
Company Overview: EVgo Inc. (NASDAQ: EVGO) is a public fast charging provider, operating more than 1,100 fast charging stations in over 40 U.S. states. The company uses a strategic approach, partnering with top businesses nationwide to deploy charging infrastructure in easily accessible, localized areas. Kalkine’s Daily Report covers the Key Financial Metrics, Risks, Outlook, Technical Analysis along with the Valuation, Target Price, and Recommendation on the stock.
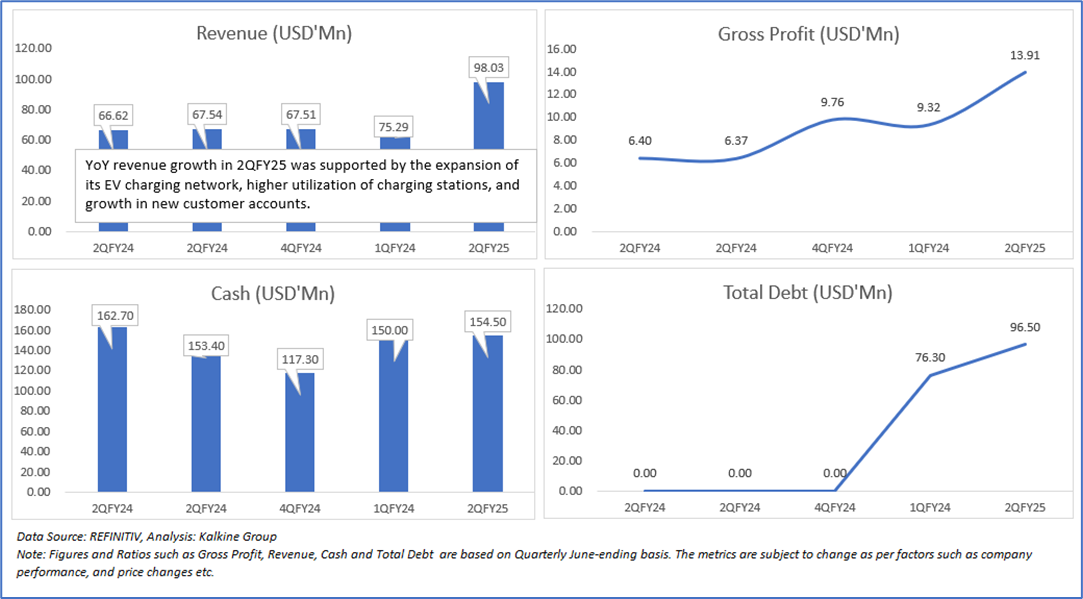
Section 1.0: Key Metrics in Pictures
Having looked at the key financial ratios above the below sections provide an in-depth fundamental, and technical analysis on this Specialty Retail stock along with recommendations, technical support and resistance levels and indicative stop-loss.
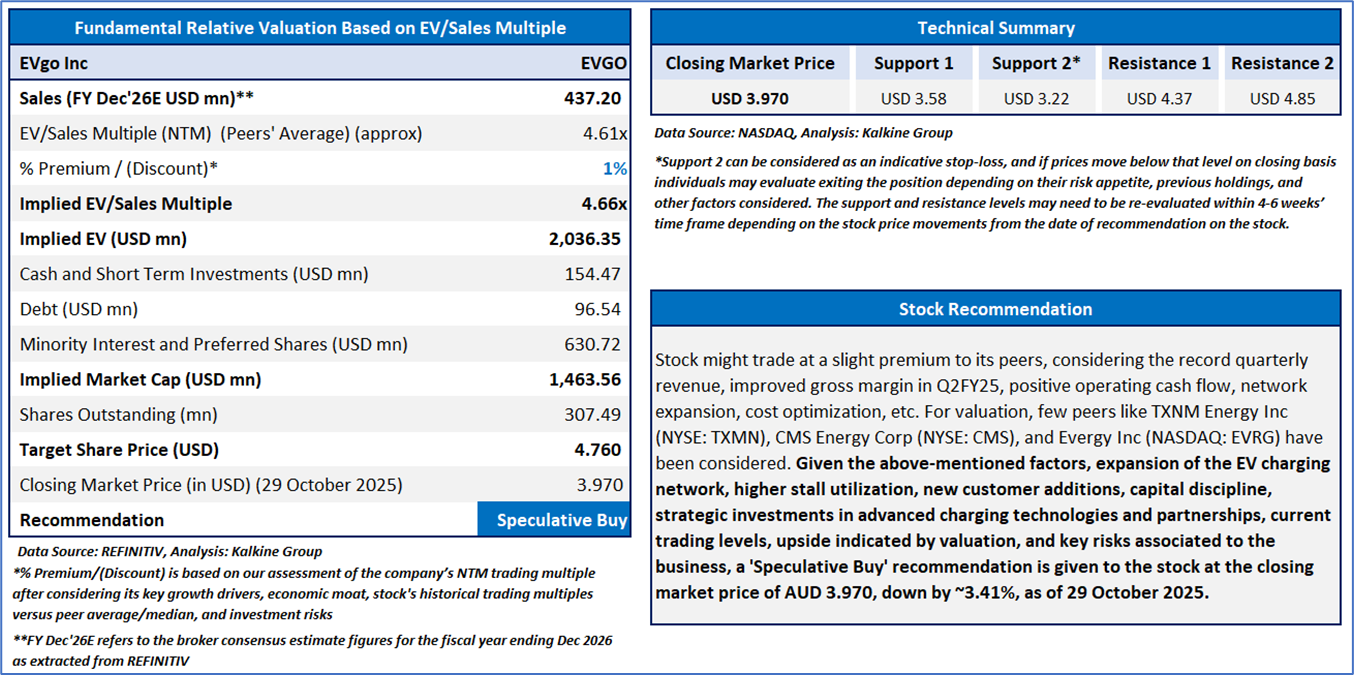
Section 2.0: EVgo Inc. (‘Speculative Buy’ at USD 3.970, Closing Market Price as on 29 October 2025)
2.1 Company Details
Valuation, Stock Recommendation, and Technical Guidance
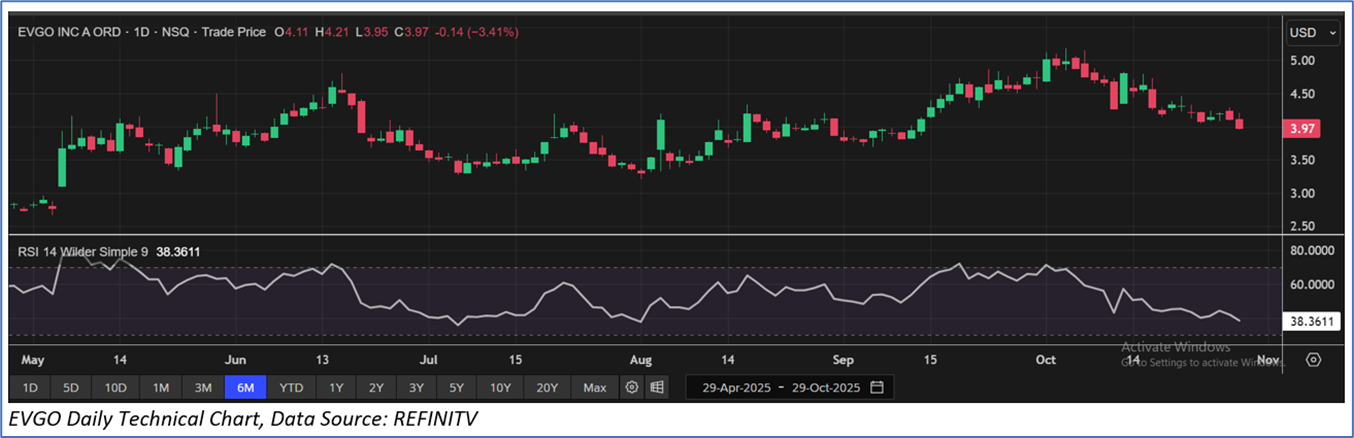
The stock has witnessed a decline of ~16.24% in the last one month and over the last one year, it has declined by ~52.56%. The stock has a 52-week low and 52-week high of USD 2.195 and USD 8.52, respectively and is currently trading below the average of 52-week low and high. EVGO was last covered in a report dated ’07 Oct 2025’.
Note 1: Past performance is not a reliable indicator of future performance.
Note 2: The reference date for all price data, currency, technical indicators, support, and resistance levels is 29 October 2025. The reference data in this report has been partly sourced from REFINITIV.
Note 3: Investment decisions should be made depending on an individual's appetite for upside potential, risks, holding duration, and any previous holdings. An 'Exit' from the stock can be considered if the Target Price mentioned as per the Valuation and or the technical levels provided has been achieved and is subject to the factors discussed above.
Note 4: Kalkine reports are prepared based on the stock prices captured either from REFINITIV or Trading View. Typically, REFINITIV or Trading View may reflect stock prices with a delay which could be a lag of 25-30 minutes. There can be no assurance that future results or events will be consistent with the information provided in the report. The information is subject to change without any prior notice.
Technical Indicators Defined: -
Support: A level at which the stock prices tend to find support if they are falling, and a downtrend may take a pause backed by demand or buying interest. Support 1 refers to the nearby support level for the stock and if the price breaches the level, then Support 2 may act as the crucial support level for the stock.
Resistance: A level at which the stock prices tend to find resistance when they are rising, and an uptrend may take a pause due to profit booking or selling interest. Resistance 1 refers to the nearby resistance level for the stock and if the price surpasses the level, then Resistance 2 may act as the crucial resistance level for the stock.
Stop-loss: It is a level to protect further losses in case of unfavourable movement in the stock prices.

 Please wait processing your request...