Ormat Technologies, Inc (NYSE: ORA)
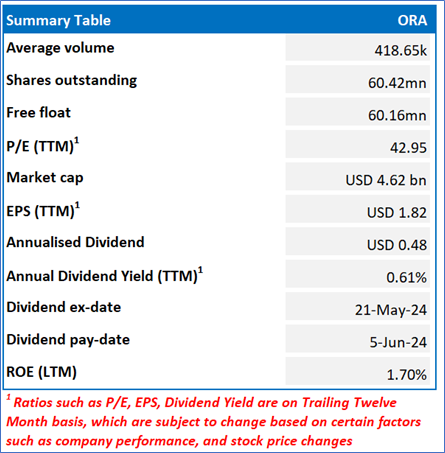
Ormat Technologies, Inc (NYSE: ORA) is a geothermal company engaged in ownership, manufacturing, designing, and selling geothermal and recovered energy generation.
Recommendation Rationale – SELL at USD 78.16
- Declining Revenues: ORA’s revenue demonstrated a sequential decline by 7.09% to USD 224.2 mn in Q1 FY24 from USD 241.3 mn in Q4 FY23. Subsequently, the gross margins were down y-o-y to 35.2% in Q1 FY24 versus 41.1% in Q1 FY23.
- Technological Risk: Company’s investments in Battery Energy Storage Systems (BESS) involve emerging and potentially advanced technologies that have a relatively short track record for reliability and performance, so their performance might not meet expectations. Additionally, ORA’s investments and profitability could be impacted by several factors, such as rising storage costs, fire risks, etc.
- Trading around Resistance: ORA’s share price has breached the R1 level recommended on 10 July 2024; and therefore, there can be a possible decline from the specified resistance levels.
- Overvalued Multiples: On a forward 12-month basis – key trading multiples such as EV/Sales, EV/EBITDA, Price/Earnings, and Price/Cash Flow are higher than the median of Electric Utilities sector.
- Market Risks: The market sentiments can remain weak in the short-term due to the subdued consumer disposable income, geopolitical tensions, and political risks. ORA’s international operations face risks from foreign regulations, emerging market instability, and geopolitical tensions in Israel, impacting production, sales, and support for their Electricity segment.
- Top of Form
- Bottom of Form
ORA’s Daily Price Chart
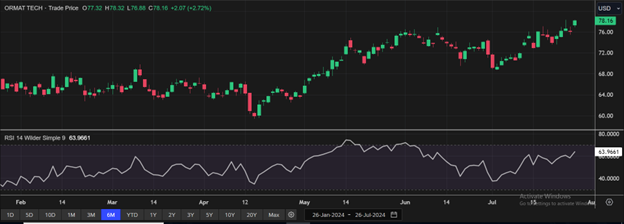
ORA Daily Technical Chart, Data Source: REFINITIV
Valuation Methodology: Price/Earnings Approach
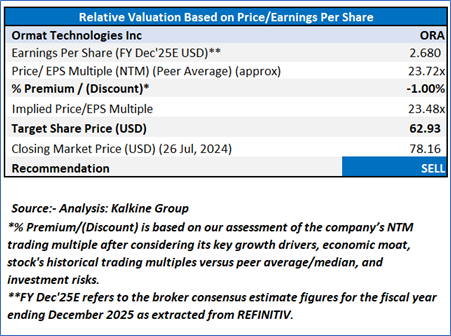
ORA is expected trade at a slight discount of 1%, primarily due to concentration of customers, geopolitical risk exposure in Israel affecting production and sales, and aforementioned technological risk. For conducting the valuation, the following peers have been considered: Constellation Energy Corporation (NASDAQ: CEG), MGE Energy Inc (NASDAQ: MGEE), and Otter Tail Corp (NASDAQ: OTTR)
Given its current trading levels, recent rally in the share price, relative valuation, and risks associated, it is prudent to book profit at the current levels.
Hence, a ‘Sell’ recommendation is given on the stock at the closing market price of USD 78.16, up by 2.72% as of 26 July 2024.
Ormat Technologies, Inc (NYSE: ORA) is the part of Kalkine’s Global Big Money Report.
Markets are trading in a highly volatile zone currently due to certain macro-economic issues and geopolitical issues prevailing geopolitical tensions. Therefore, it is prudent to follow a cautious approach while investing.
Note 1: Past performance is neither an indicator nor a guarantee of future performance.
Note 2: The reference date for all price data, currency, technical indicators, support, and resistance levels is 26 July 2024. The reference data in this report has been partly sourced from REFINITIV.
Note 3: Investment decisions should be made depending on an individual's appetite for upside potential, risks, holding duration, and any previous holdings. An 'Exit' from the stock can be considered if the Target Price mentioned as per the Valuation and or the technical levels provided has been achieved and is subject to the factors discussed above.
Technical Indicators Defined: -
Support: A level at which the stock prices tend to find support if they are falling, and downtrend may take a pause backed by demand or buying interest.
Resistance: A level at which the stock prices tend to find resistance when they are rising, and uptrend may take a pause due to profit booking or selling interest.
Stop-loss: In general, it is a level to protect further losses in case of any unfavourable movement in the stock prices.

 Please wait processing your request...