This report is an updated version of the report published on 16 April 2025 at 11:55 AM AEST.
Arafura Rare Earths Limited (ASX: ARU)
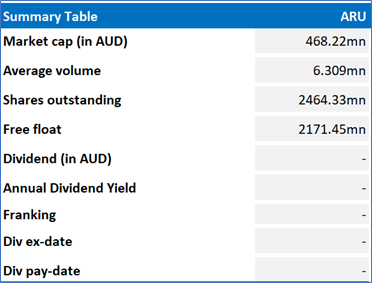
Arafura Rare Earths Limited (ASX: ARU) engages in the exploration and development of mineral properties in Australia, which focuses on the production of rare earth products, such as neodymium-praseodymium and mixed middle-heavy rare earth oxides.
Recommendation Rationale – SELL at AUD 0.195
- Overvalued Multiples: On a Forward 12-month basis, the stock is trading at a P/BV multiple of 2.0x vs Industry (Metals & Mining) Median of 1.4x and thus seems overvalued.
- Trading Around Resistance:ARU’s share price surpassed its R1 level recommended on 14 April 2025.
- Technical Commentary: While undergoing a rally, ARU’s stock prices are approaching its previous peak, anticipating a potential minor correction. Additionally, the 14-period RSI momentum oscillator is also trading near its overbought territory, providing further support for the previous observation. Prices are currently trading above both the trend-following indicators 21-day and 50-day SMAs, which could serve as dynamic support levels for the stock; in contrast, the stock’s 2024 high may act as a resistance.
- Losses in 1HFY25: In the first half of FY25, ARU reported a net loss of AUD 18.85 million, with other income falling 44.5% year-over-year.
- Emerging Risks: ARU's Nolans Project requires significant capital investment. Delays or difficulties in securing full funding or making a Final Investment Decision (FID) could hinder project timelines and viability. The company’s revenue heavily depends on the global demand and pricing for rare earth elements, particularly NdPr oxide. Market volatility or reduced demand from key sectors like EVs and wind energy could impact profitability.
ARU Daily Chart
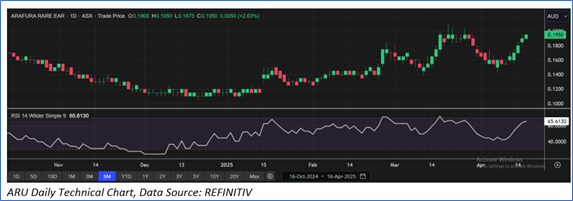
Considering that the stock has surpassed its R1 level, macroeconomic uncertainty, current trading level, and risks associated, the share price can face consolidation at the current levels. Hence, a ‘Sell’ recommendation is given on the stock at the current price of AUD 0.195 (as of 16 April 2025, at 11:19 AM AEST).
Note: This report may be updated with details around fundamental and technical analysis, price/ chart in due course, as appropriate.
Note 1: Past performance is neither an indicator nor a guarantee of future performance.
Note 2: The reference date for all price data, currency, technical indicators, support, and resistance levels is 16 April 2025. The reference data in this report has been partly sourced from REFINITIV.
Note 3: Investment decisions should be made depending on an individual's appetite for upside potential, risks, holding duration, and any previous holdings. An 'Exit' from the stock can be considered if the Target Price mentioned as per the Valuation and or the technical levels provided has been achieved and is subject to the factors discussed above.
Note 4: Kalkine reports are prepared based on the stock prices captured either from REFINITIV or Trading View. Typically, REFINITIV or Trading View may reflect stock prices with a delay which could be a lag of 25-30 minutes. There can be no assurance that future results or events will be consistent with the information provided in the report. The information is subject to change without any prior notice.
Technical Indicators Defined: -
Support: A level at which the stock prices tend to find support if they are falling, and a downtrend may take a pause backed by demand or buying interest. Support 1 refers to the nearby support level for the stock and if the price breaches the level, then Support 2 may act as the crucial support level for the stock.
Resistance: A level at which the stock prices tend to find resistance when they are rising, and an uptrend may take a pause due to profit booking or selling interest. Resistance 1 refers to the nearby resistance level for the stock and if the price surpasses the level, then Resistance 2 may act as the crucial resistance level for the stock.
Stop-loss: It is a level to protect further losses in case of unfavourable movement in the stock prices.

 Please wait processing your request...