This report is an updated version of the report published on 29 August 2025 at 11:36 AM AEST.
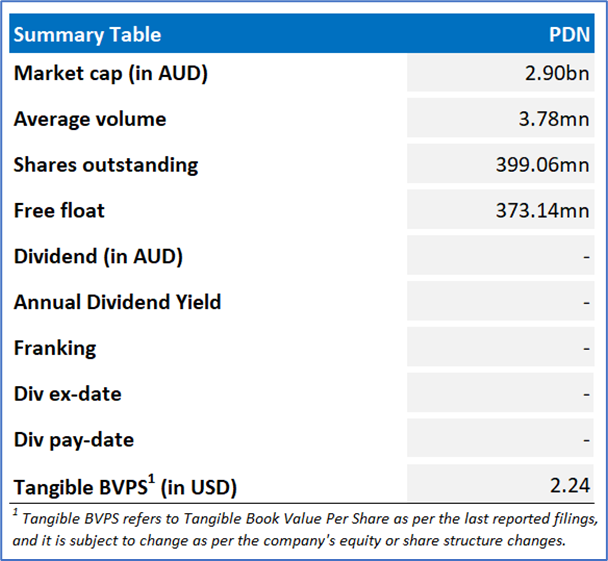
Paladin Energy Limited (ASX: PDN)
Paladin Energy Limited (ASX: PDN) is engaged in the development, exploration, evaluation, and operation of uranium mining projects across Australia, Canada, and Namibia. The company focuses on advancing its uranium portfolio to support the growing global demand for clean energy solutions.
Recommendation Rationale – SELL at AUD 8.190
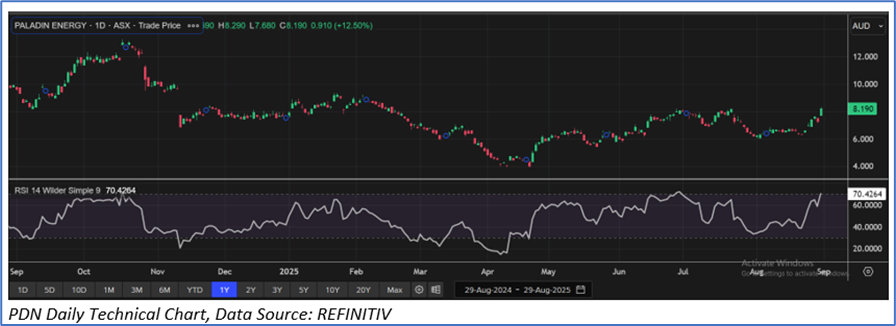
- Technical Standpoint: PDN's share price surpassed its R2 level as recommended on 31 July 2025. Also, the momentum oscillatory (14-day RSI is around 70.4 level), indicating an overbought zone. This shows increasing likelihood of near-term consolidation or technical pullback.
- Overvalued Multiples: On a Forward 12-month basis - key valuation multiples (EV/Sales, EV/EBITDA, P/E, P/BV, and P/CF) are higher than the median of the Energy industry.
- Financial Performance: In FY25, Paladin Energy reported a loss after tax of USD 76.5 million, a sharp reversal from a profit of USD 59.9 million in the previous year. The company also recorded a gross operating loss of USD 26.1 million, which included a USD 12.0 million impairment charge on inventories as of 30 June 2025, due to a decline in the net realisable value of ore stockpiles and finished goods.
- Emerging Risks: PDN faces operational risks from ramp-up delays at Langer Heinrich, ongoing financial losses, exposure to volatile uranium prices, execution uncertainty in projects, and high share price volatility driven by market sentiment and institutional investor activity. PDN is also exposed to exploration risk, project delays, and cost overruns.
PDN Daily Chart
Valuation Methodology: EV/Sales Approach (FY June'26E) (Illustrative)
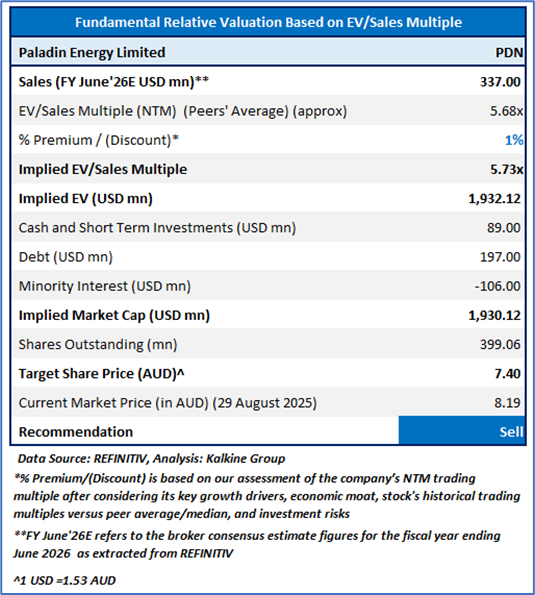
Considering the completion of Fission Uranium Corp. acquisition, successful PLS winter drilling program, 13 sales agreements with tier-one global customers, etc., the stock might trade at a slight premium to its peers. For valuation, a few peers Lotus Resources Ltd (ASX: LOT), Boss Energy Ltd (ASX: BOE), Amplitude Energy Ltd (ASX: AEL), and others have been considered.
Considering that the stock has surpassed it R2 level, macroeconomic uncertainty, share price movement, current trading level, and risks associated, the share price can face consolidation at the current levels. Hence, a ‘Sell’ recommendation is given on the stock at the current market price of AUD 8.19, at 10:42 AM AEST, as of 29 August 2025.
Markets are trading in a highly volatile zone currently due to certain macro-economic issues and geopolitical issues prevailing geopolitical tensions. Therefore, it is prudent to follow a cautious approach while investing.
Note 1: Past performance is neither an indicator nor a guarantee of future performance.
Note 2: The reference date for all price data, currency, technical indicators, support, and resistance levels is 29 August 2025. The reference data in this report has been partly sourced from REFINITIV.
Note 3: Investment decisions should be made depending on an individual's appetite for upside potential, risks, holding duration, and any previous holdings. An 'Exit' from the stock can be considered if the Target Price mentioned as per the Valuation and or the technical levels provided has been achieved and is subject to the factors discussed above.
Note 4: Kalkine reports are prepared based on the stock prices captured either from REFINITIV or Trading View. Typically, REFINITIV or Trading View may reflect stock prices with a delay which could be a lag of 25-30 minutes. There can be no assurance that future results or events will be consistent with the information provided in the report. The information is subject to change without any prior notice.
Technical Indicators Defined: -
Support: A level at which the stock prices tend to find support if they are falling, and a downtrend may take a pause backed by demand or buying interest. Support 1 refers to the nearby support level for the stock and if the price breaches the level, then Support 2 may act as the crucial support level for the stock.
Resistance: A level at which the stock prices tend to find resistance when they are rising, and an uptrend may take a pause due to profit booking or selling interest. Resistance 1 refers to the nearby resistance level for the stock and if the price surpasses the level, then Resistance 2 may act as the crucial resistance level for the stock.
Stop-loss: It is a level to protect further losses in case of unfavourable movement in the stock prices.
 Please wait processing your request...