This report is an updated version of the report published on 30 September 2025 after market closing
HA Sustainable Infrastructure Capital, Inc. (NYSE: HASI),
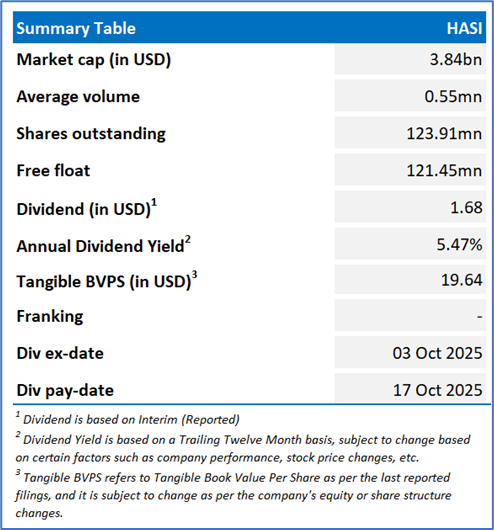
HASI, formerly Hannon Armstrong Sustainable Infrastructure Capital, Inc., is a climate-positive investment firm that collaborates with clients to deploy real assets that support the energy transition. The company invests across a diverse range of asset classes within its three primary climate solutions markets: Behind the Meter, Grid-Connected, and Fuels, Transport, and Nature.
Recommendation Rationale – SELL at USD 30.89
- Financial Highlights: Total revenue decreased to USD 85.69mn in Q2FY25 vs USD 94.52mn in Q2FY24. This decrease was primarily attributed to a reduction in gain on asset sale, which was. Total operating expenses increased to USD 105.41mn in 2QFY25 vs USD 84.10mn in 2QFY24.
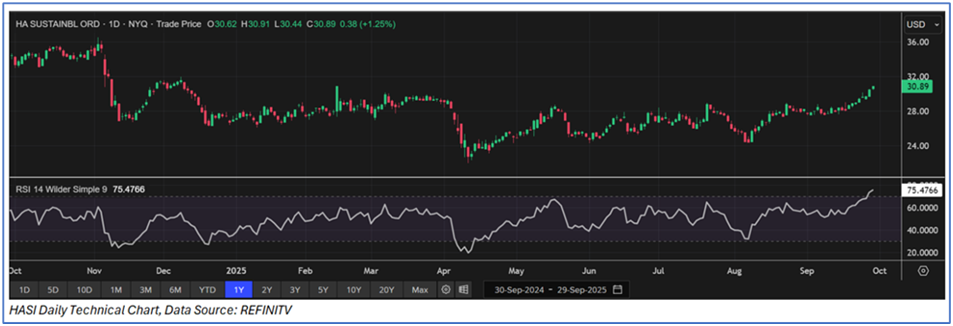
- Trading Near the Resistance: HASI stock is approaching its R2 level recommended on 08 May 2025. Its 14-day RSI is showing a reading of ~75.48, indicating it has entered the overbought zone.
- Overvalued Multiples: On a forward 12-month basis – key trading multiples (EV/Sales, EV/EBITDA, Price/Cash Flow, Price/Earnings, Price/ Book Value) are higher than Median of the Financials sector.
- Market Risk: HASI has been borrowing (debt) and uses credit facilities. If interest rates rise, cost of capital will increase, potentially squeezing margins. Also, mismatch in the duration of liabilities (debt) vs the duration of assets (long‑lived infrastructure contracts projects) can cause risk.
HASI’ Daily Price Chart
Valuation Methodology: Price/Earnings Multiple Approach (FY December'26E) (Illustrative)
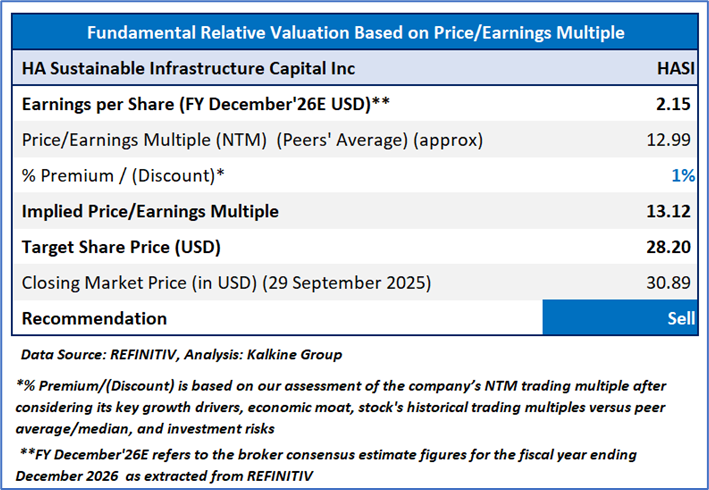
Stock might trade at a slight premium to its peers considering the YoY adjusted EPS growth in 2QFY25, improved credit profile, and high new asset yields. For conducting the valuation, the following peers included: Mr Cooper Group Inc (NASDAQ: COOP), UWM Holdings Corp (NYSE: UWMC), PennyMac Financial Services Inc (NYSE: PFSI), and others.
Given the stock is approaching to its R2 level, recent rally in the share price, and risks associated, it is prudent to sell the stock at the current levels. Hence, a ‘Sell’ recommendation is given on the stock at the closing market price of USD 30.89, as of 29 September 2025.
Markets are trading in a highly volatile zone currently due to certain macro-economic issues and geopolitical issues prevailing geopolitical tensions. Therefore, it is prudent to follow a cautious approach while investing.
Note 1: Past performance is neither an indicator nor a guarantee of future performance.
Note 2: The reference date for all price data, currency, technical indicators, support, and resistance levels is 29 September 2025. The reference data in this report has been partly sourced from REFINITIV.
Note 3: Investment decisions should be made depending on an individual's appetite for upside potential, risks, holding duration, and any previous holdings. An 'Exit' from the stock can be considered if the Target Price mentioned as per the Valuation and or the technical levels provided has been achieved and is subject to the factors discussed above.
Note 4: Kalkine reports are prepared based on the stock prices captured either from REFINITIV or Trading View. Typically, REFINITIV or Trading View may reflect stock prices with a delay which could be a lag of 25-30 minutes. There can be no assurance that future results or events will be consistent with the information provided in the report. The information is subject to change without any prior notice.
Note 5: Dividend Yield may vary as per the stock price movement.
Technical Indicators Defined: -
Support: A level at which the stock prices tend to find support if they are falling, and downtrend may take a pause backed by demand or buying interest.
Resistance: A level at which the stock prices tend to find resistance when they are rising, and uptrend may take a pause due to profit booking or selling interest.
Stop-loss: In general, it is a level to protect further losses in case of any unfavourable movement in the stock prices.

 Please wait processing your request...