This report is an updated version of the report published on 11 December 2025 at 1:15 PM AEDT.
Ramelius Resources Limited (ASX: RMS)
Ramelius Resources Limited (ASX: RMS) is a Western Australian gold producer with operations dating back to 2006. The company owns and operates several key assets, including the Edna May, Marda, Mt Magnet, Penny, Symes, and Tampia gold mines. Ramelius is committed to growth through exploration and development, maintaining a portfolio of gold projects across Western Australia.
Recommendation Rationale – SELL at AUD 3.880
- Technical Standpoint: RMS’ share price has surpassed the R1 level recommended on 8 December 2025. This quick upward move raises the risk of short-term consolidation or downside retracement.
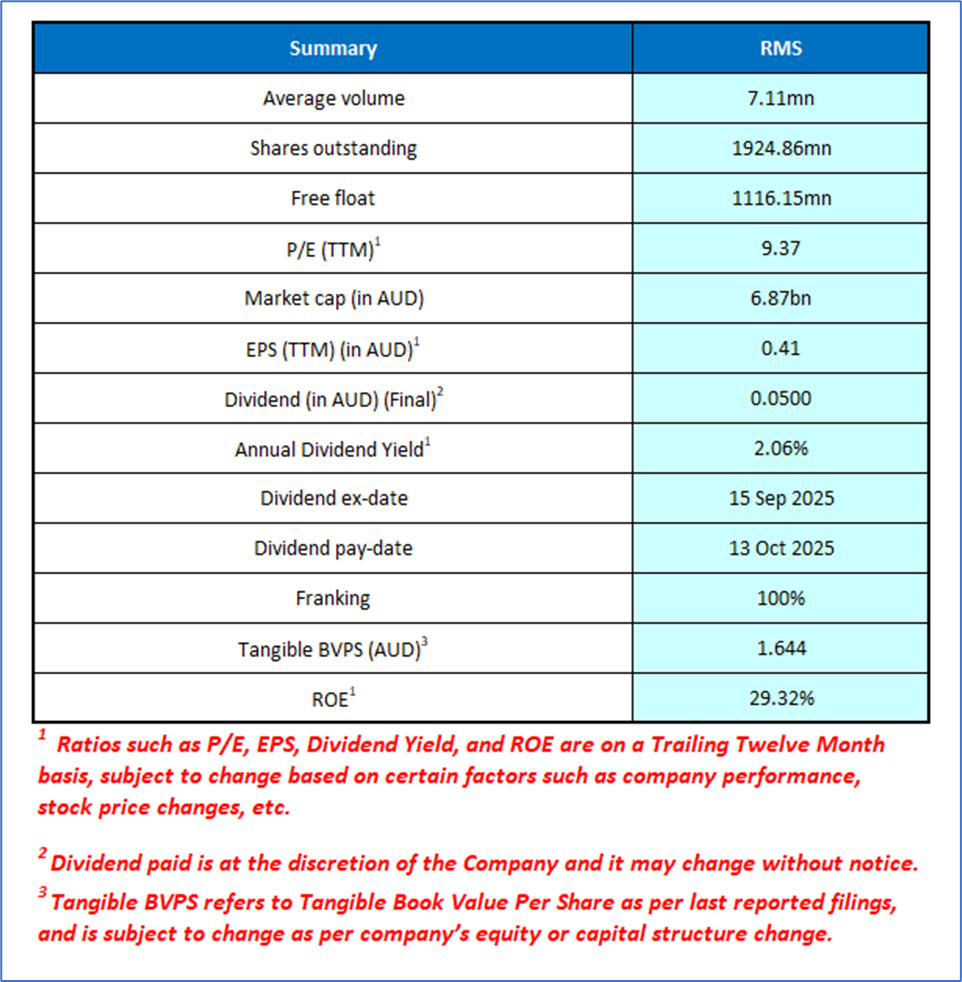
- Production Decline: Ramelius Resources reported Q1 FY26 gold production of 55,013 ounces, a 25% drop from the prior quarter, driven by lower mined and milled grades at key sites like Cue and Penny West.
- Operational Weakness: In Q1 FY26, mined grades fell to 2.74 g/t (from 6.87 g/t in Q4 FY25) and milled grades to 3.30 g/t, reflecting Cue's transition to lower-grade fresh rock and increased low-grade ore from Penny West. Forward guidance signals further declines, before potential recovery from new projects like Dalgaranga, raising concerns over near-term delivery.
- Cost Pressures: AISC rose sharply to AU$1,836/oz in Q1 FY26 from AU$1,339/oz in Q4 FY25, eroding margins despite a realized gold price of AU$4,528/oz, due to lower volumes and integration costs from the Spartan acquisition.
- Outlook Scenario: RMS’ growth and medium-term production outlook depends on successfully integrating the Spartan acquisition and optimising the combined Mt Magnet–Dalgaranga operations, yet management notes the integration/optimisation work is still to be undertaken and the “500kozpa by FY30” ambition is explicitly aspirational (not a firm production target).
Daily Price Chart
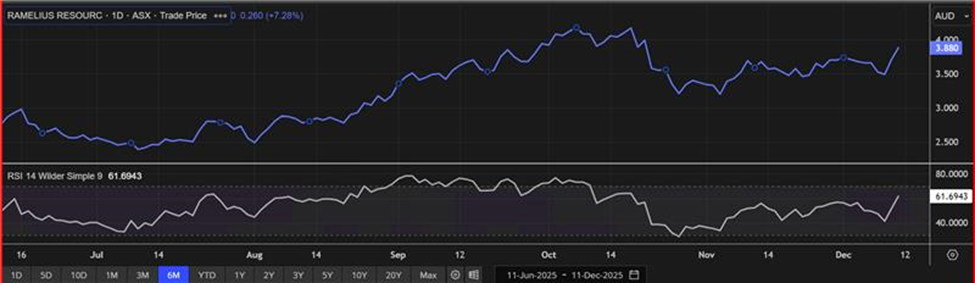
(Source: REFINITIV; Analysis by Kalkine Group)
Valuation Methodology: Price/Cash Flow Value Approach (FY June'26E) (Illustrative)
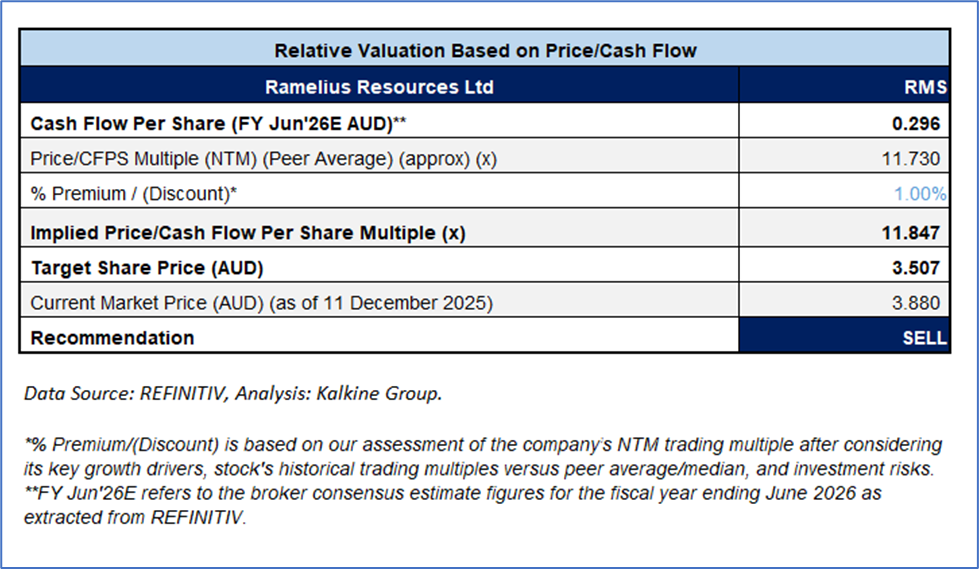
The stock may trade at a slight premium to peers given the ambitious 5-year plan targets 500kozpa, liquidity position (AU$827.7 million cash at Q1 FY26 end, net cash position), and 110.77% YoY growth in FY25 EPS (earnings per share). For valuation, the following peers have been considered - Evolution Mining Ltd (ASX: EVN), Capricorn Metals Ltd (ASX: CMM), and Emerald Resources NL (ASX: EMR).
Given the stock is approaching to its R2 level, recent rally in the share price, and risks associated, it is prudent to sell the stock at the current levels. Hence, a ‘Sell’ recommendation is given on the stock at the current market price of AUD 3.88, as of 11 December 2025, at 12:16 PM AEDT.
Markets are trading in a highly volatile zone currently due to certain macro-economic issues and geopolitical issues prevailing geopolitical tensions. Therefore, it is prudent to follow a cautious approach while investing.
Note 1: Past performance is neither an indicator nor a guarantee of future performance.
Note 2: The reference date for all price data, currency, technical indicators, support, and resistance levels is 11 December 2025. The reference data in this report has been partly sourced from REFINITIV.
Note 3: Investment decisions should be made depending on an individual's appetite for upside potential, risks, holding duration, and any previous holdings. An 'Exit' from the stock can be considered if the Target Price mentioned as per the Valuation and or the technical levels provided has been achieved and is subject to the factors discussed above.
Note 4: Kalkine reports are prepared based on the stock prices captured either from REFINITIV or Trading View. Typically, REFINITIV or Trading View may reflect stock prices with a delay which could be a lag of 25-30 minutes. There can be no assurance that future results or events will be consistent with the information provided in the report. The information is subject to change without any prior notice.
Note 5: Dividend Yield may vary as per the stock price movement.
Technical Indicators Defined: -
Support: A level at which the stock prices tend to find support if they are falling, and downtrend may take a pause backed by demand or buying interest.
Resistance: A level at which the stock prices tend to find resistance when they are rising, and uptrend may take a pause due to profit booking or selling interest.
Stop-loss: In general, it is a level to protect further losses in case of any unfavourable movement in the stock prices.

 Please wait processing your request...