This report is an updated version of the report published on 28 November 2025 at 12:57 PM AEDT.
GQG Partners Inc (ASX: GQG)
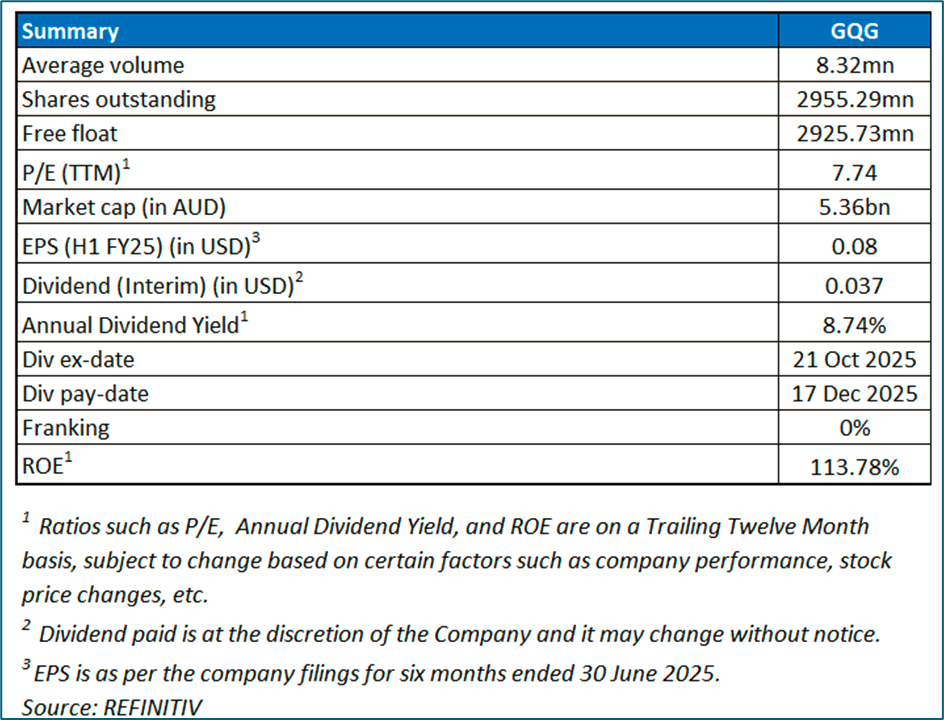
GQG Partners Inc (ASX: GQG) is a global boutique asset management firm specializing in the active management of equity portfolios for a diverse client base, including pension funds, sovereign wealth funds, wealth managers, and institutional investors.
Recommendation Rationale – SELL at AUD 1.855
- Technical Standpoint: GQG’s share price has surpassed the R2 level recommended on 10 November 2025. The 14-day RSI is now around 74.35, trading in overbought territory. This upward move raises the risk of short-term consolidation or downside retracement.
- Higher operating cost intensity: Total operating expenses increased to USD 96.3 million in H1 FY25, from USD 89.9 million in H1FY24, indicating rising cost pressure.
- Decline in performance fee income: Performance fees fell to USD 13.8 million in H1 FY25, from USD 19.4 million in H1 FY24, reflecting reduced variable revenue.
- Business Risk: GQG Partners faces exposure to fluctuations in fund flows and market performance, where periods of weaker relative returns can drive client redemptions, reduce fee income, and heighten operational uncertainty tied to maintaining investment talent and strategy stability.
- Overvalued Multiples: On a forward 12-month – key valuation multiples (EV/Sales, and Price/Book) are higher than average of the Financials’ sector.
GQG Daily Chart
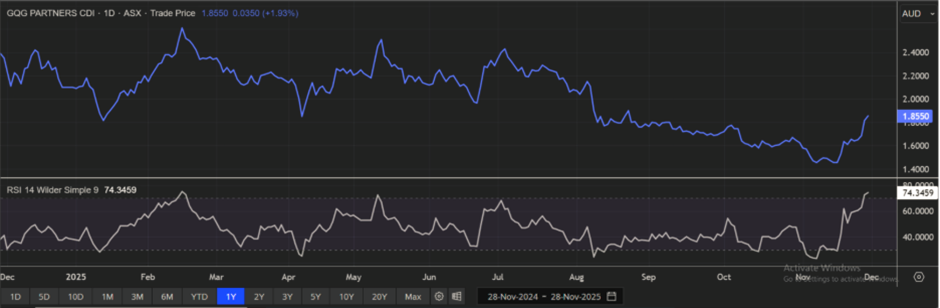
Daily Technical Chart, Data Source: REFINITIV
Valuation Methodology: Price/Book Value Approach (FY Dec'26E) (Illustrative)
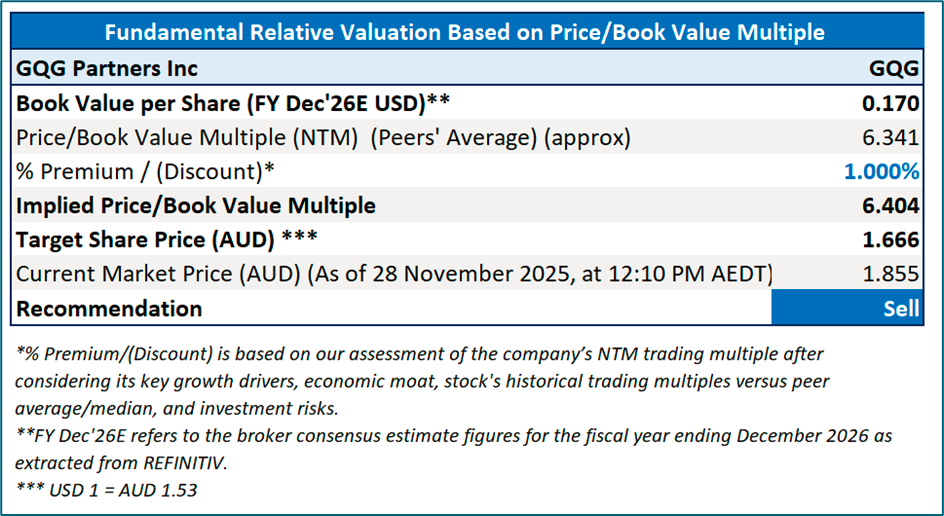
The stock may trade at a slight premium to peers given the lift in total revenue to USD 403.0 million in H1 FY25 from USD 363.1 million in H1 FY24, the increase in net income to USD 230.2 million from USD 201.2 million, and the expansion in cash to USD 100.3 million from USD 94.4 million over the same period.
For conducting the valuation, peers including Macquarie Group Ltd (ASX: MQG), AUB Group Ltd (ASX: AUB), HUB24 Ltd (ASX: HUB) and others have been considered.
Given the stock is approaching to its R2 level, recent rally in the share price, and risks associated, it is prudent to sell the stock at the current levels. Hence, a ‘Sell’ recommendation is given on the stock at the current market price of AUD 1.855, as of 28 November 2025, at 12:10 PM AEDT.
Markets are trading in a highly volatile zone currently due to certain macro-economic issues and geopolitical issues prevailing geopolitical tensions. Therefore, it is prudent to follow a cautious approach while investing.
Note 1: Past performance is neither an indicator nor a guarantee of future performance.
Note 2: The reference date for all price data, currency, technical indicators, support, and resistance levels is 28 November 2025. The reference data in this report has been partly sourced from REFINITIV.
Note 3: Investment decisions should be made depending on an individual's appetite for upside potential, risks, holding duration, and any previous holdings. An 'Exit' from the stock can be considered if the Target Price mentioned as per the Valuation and or the technical levels provided has been achieved and is subject to the factors discussed above.
Note 4: Kalkine reports are prepared based on the stock prices captured either from REFINITIV or Trading View. Typically, REFINITIV or Trading View may reflect stock prices with a delay which could be a lag of 25-30 minutes. There can be no assurance that future results or events will be consistent with the information provided in the report. The information is subject to change without any prior notice.
Note 5: Dividend Yield may vary as per the stock price movement.
Technical Indicators Defined: -
Support: A level at which the stock prices tend to find support if they are falling, and downtrend may take a pause backed by demand or buying interest.
Resistance: A level at which the stock prices tend to find resistance when they are rising, and uptrend may take a pause due to profit booking or selling interest.
Stop-loss: In general, it is a level to protect further losses in case of any unfavourable movement in the stock prices

 Please wait processing your request...