Rio Tinto Limited (ASX: RIO)
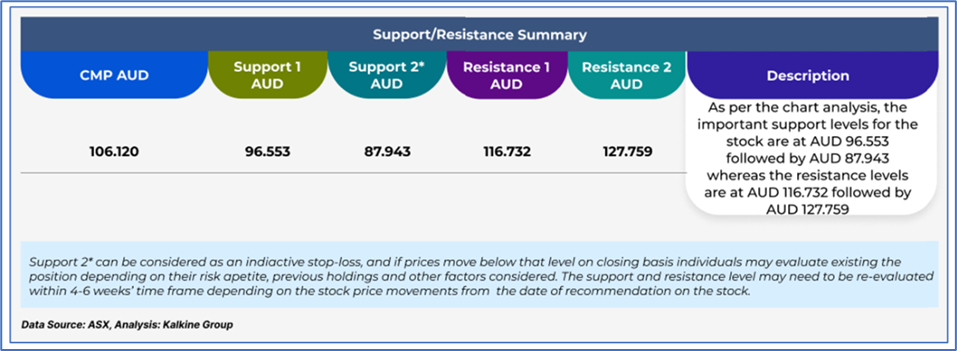
Company Overview: Rio Tinto Limited (ASX: RIO) is involved in the production of gold, copper, iron ore, aluminum, coal, titanium dioxide, borates, and minerals and metals. As per the previous recommendation on RIO on 1 July 2025, a ‘Buy’ rating was given on the stock at AUD 106.120, and noted below are the details of support and resistance provided in the previous report:
Previous Recommendation Summary as on 1 July 2025
Daily Price Chart
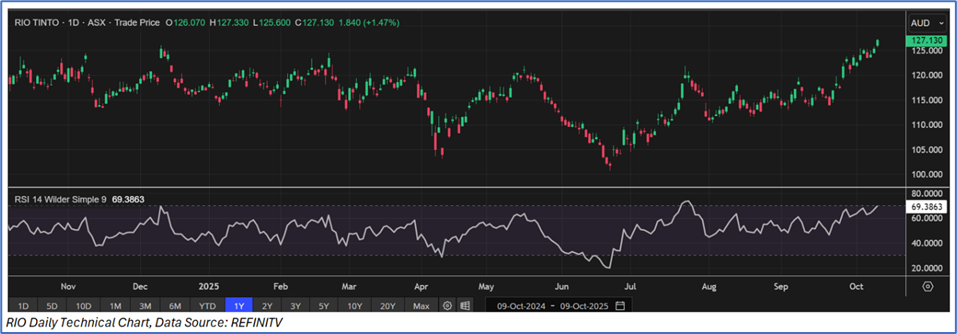
Given the stock is approaching to its R2 level, recent rally in the share price, and risks associated, it is prudent to sell the stock at the current levels. Hence, a ‘Sell’ recommendation is given on the stock at the current market price of AUD 127.130, as of 09 October 2025, at 1:14 PM AEDT.
Rio Tinto Limited (ASX: RIO) is a part of Global Fully Charged Portfolio.
Note: This report may be updated with details around fundamental and technical analysis, price/chart in due course, as appropriate.
Note 1: Past performance is neither an indicator nor a guarantee of future performance.
Note 2: The reference date for all price data, currency, technical indicators, support, and resistance levels is 09 October 2025. The reference data in this report has been partly sourced from REFINITIV.
Note 3: Investment decisions should be made depending on an individual's appetite for upside potential, risks, holding duration, and any previous holdings. An 'Exit' from the stock can be considered if the Target Price mentioned as per the Valuation and or the technical levels provided has been achieved and is subject to the factors discussed above.
Note 4: Kalkine reports are prepared based on the stock prices captured either from REFINITIV or Trading View. Typically, REFINITIV or Trading View may reflect stock prices with a delay which could be a lag of 25-30 minutes. There can be no assurance that future results or events will be consistent with the information provided in the report. The information is subject to change without any prior notice.
Note 5: Dividend Yield may vary as per the stock price movement.
Technical Indicators Defined: -
Support: A level at which the stock prices tend to find support if they are falling, and downtrend may take a pause backed by demand or buying interest.
Resistance: A level at which the stock prices tend to find resistance when they are rising, and uptrend may take a pause due to profit booking or selling interest.
Stop-loss: In general, it is a level to protect further losses in case of any unfavourable movement in the stock prices.

 Please wait processing your request...