Trinity Capital Inc
Trinity Capital Inc. (NASDAQ: TRIN) is an internally managed, closed-end, non-diversified management investment company that operates as a business development company. It is a specialty lending company that provides debt, including loans and equipment financings, to growth-stage companies, including venture-backed companies and companies with institutional equity investors. Its investment objective is to generate current income and capital appreciation through its investments across five vertical markets.
As per our previous US Earning Hunter Report published on ‘TRIN’ on September 26, 2025, we provided an ‘Attractive’ stance on the stock at USD 16.00 based on “price action, recent key business and financial updates, momentum in the stock over the last month, Earning Hunter score, and technical indicators analysis”.
Noted below are the details of support and resistance levels provided in our previous report:

Rationales for an “Unattractive” rating:
- Yield Compression and Declining Per-Share Earnings Dynamics: Despite reporting record net investment income of USD 39.9 million in Q4 2025, earnings quality reflects emerging pressure at the per-share level, with NII per share declining to USD 0.52 from USD 0.58 in the prior-year period. Additionally, the effective yield on debt investments declined to 15.2% from 16.4% year-over-year, indicating compression in portfolio yields. This combination of declining yields and diluted per-share earnings suggests that incremental growth is being offset by structural pressures, including capital deployment dynamics and competitive lending conditions.
- Rising Cost Structure and Interest Expense Burden: Operating expenses and financing costs have trended upward, with total operating expenses increasing to USD 19.4 million from USD 17.2 million, alongside a notable rise in interest expense to USD 23.9 million from USD 19.1 million year-over-year. The increase in interest expense is primarily driven by higher average debt outstanding, reflecting greater leverage utilization. This cost escalation may constrain net income expansion and compress margins, particularly if borrowing costs remain elevated or investment yields continue to moderate.
- Elevated Leverage and Dependence on External Capital: Trinity Capital maintains a relatively high leverage profile, with a debt-to-equity ratio of approximately 119% as of December 2025. Furthermore, the company continues to rely on equity issuance through its ATM program, raising USD 95.2 million during the quarter. While such capital raising supports portfolio growth, it introduces dilution risk for existing shareholders and underscores dependence on capital markets to sustain expansion. This structure may become less favorable in tighter liquidity environments.
- Realized Losses and Portfolio Risk Indicators: During Q4 2025, the company reported net realized losses of approximately USD 33.9 million, primarily linked to debt investment conversions. Additionally, investments on non-accrual status totaled USD 15.2 million, representing 0.7% of the debt portfolio. While this level remains manageable, it highlights underlying credit risk within a venture-focused lending portfolio. The presence of “watch” and “default/workout” categories within the investment risk framework further indicates potential vulnerability to borrower performance deterioration.
- Growth Driven by Capital Deployment Rather Than Organic Stability: The company’s strong asset growth—evidenced by a 36.2% increase in investment portfolio and 38.2% rise in assets under management—has been largely fueled by aggressive capital deployment and funding activity. However, this growth model is inherently dependent on continuous deal origination and external capital availability. Coupled with moderate liquidity of USD 335.2 million and ongoing borrowing capacity utilization, this raises questions regarding the sustainability of growth without increasing financial risk or diluting returns over time.
Daily Chart
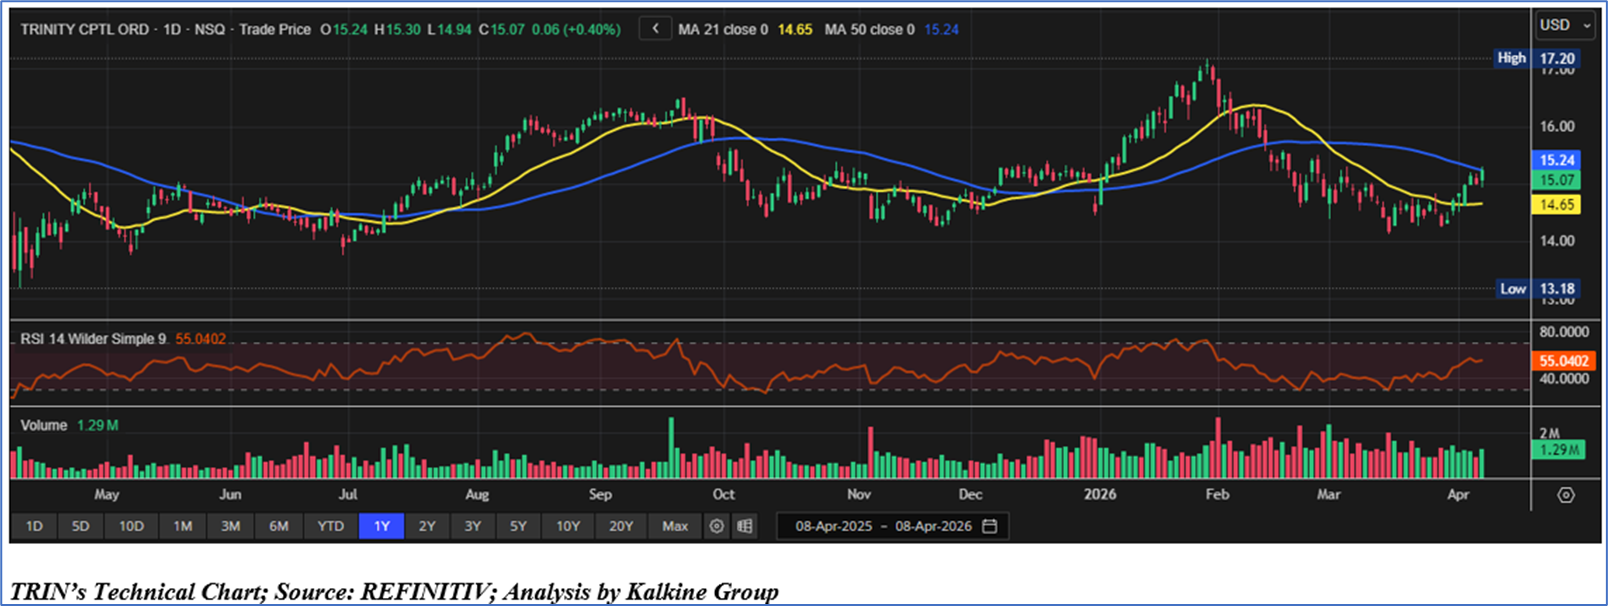
Considering the moderation in per-share earnings despite record net investment income (with NII per share declining year-over-year), compression in portfolio yields (down to 15.2% from 16.4%), rising cost pressures driven by higher operating and interest expenses, elevated leverage with a debt-to-equity ratio of ~119% alongside continued reliance on equity issuances, and exposure to credit risks reflected in realized losses and non-accrual investments despite strong portfolio growth and dividend consistency, an ‘Unattractive’ rating is assigned to the ‘TRIN’ at the closing market price of USD 15.07, as of April 08, 2026.
Note: This report may be updated with details around fundamental and technical analysis, price chart in due course, as appropriate.
Note 1: Past performance is not a reliable indicator of future performance.
Note 2: The reference date for all price data, currency, technical indicators, support, and resistance level is April 08, 2026. The reference data in this report has been partly sourced from REFINITIV.
Note 3: Investment decisions should be made depending on an individual's appetite for upside potential, risks, holding duration, and any previous holdings. An 'Exit' from the stock can be considered if the Target Price mentioned as per the Valuation and or the technical levels provided has been achieved and is subject to the factors discussed above.
Note 4: Target Price refers to a price level that the stock is expected to reach as per the relative valuation method and or technical analysis taking into consideration both short-term and long-term scenarios.
Note 5: ‘Kalkine reports are prepared based on the stock prices captured either from the New York Stock Exchange (NYSE), NASDAQ Capital Markets (NASDAQ), and or REFINITIV. Typically, all sources (NYSE, NASDAQ, or REFINITIV) may reflect stock prices with a delay which could be a lag of 15-20 minutes. There can be no assurance that future results or events will be consistent with the information provided in the report. The information is subject to change without any prior notice.

 NZ
 UK
 US
 AU
 IND

 CA

 Please wait processing your request...